University courses, professional workshops,
public talks and presentations.
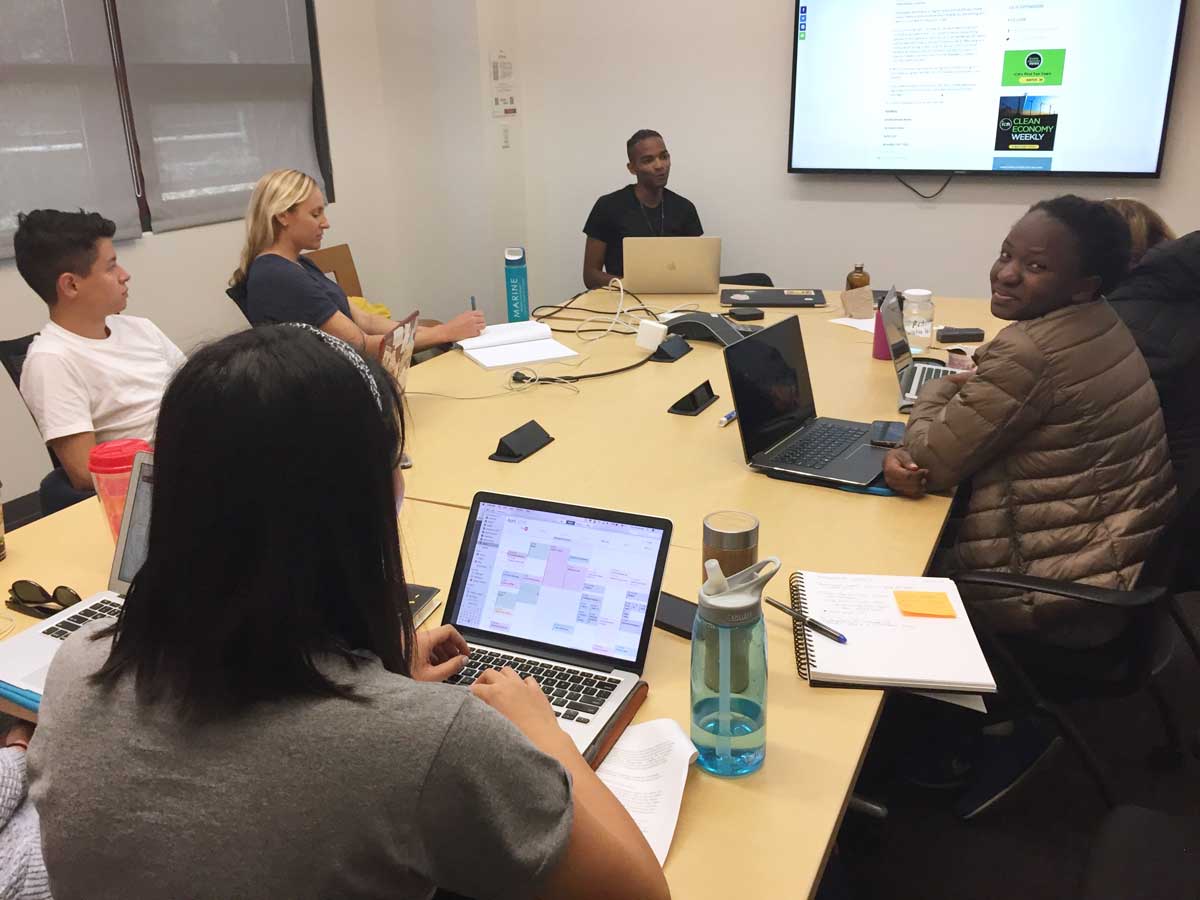
The Multimedia Story
Earthsys 190 | Stanford University, Spring 2018
Stories are how we understand ourselves and the world. This course teaches how to plan, research, report and produce a long-form, rich-media science/environment feature story. Students work in groups or individually to master the blending of text with data analysis, visualization, photos, audio, and video. Teachers are experienced digital journalists at leading national and international publications with a close eye on trends and innovations in online, investigative, and data journalism. Using the landmark New York Times story Snow Fall (http://nyti.ms/1eTyf2Y) as a departure point, the course examines the questions: how do we engage and inform the public around critical environmental topics? How do we explain complex and sometimes hidden factors shaping the future of our world?
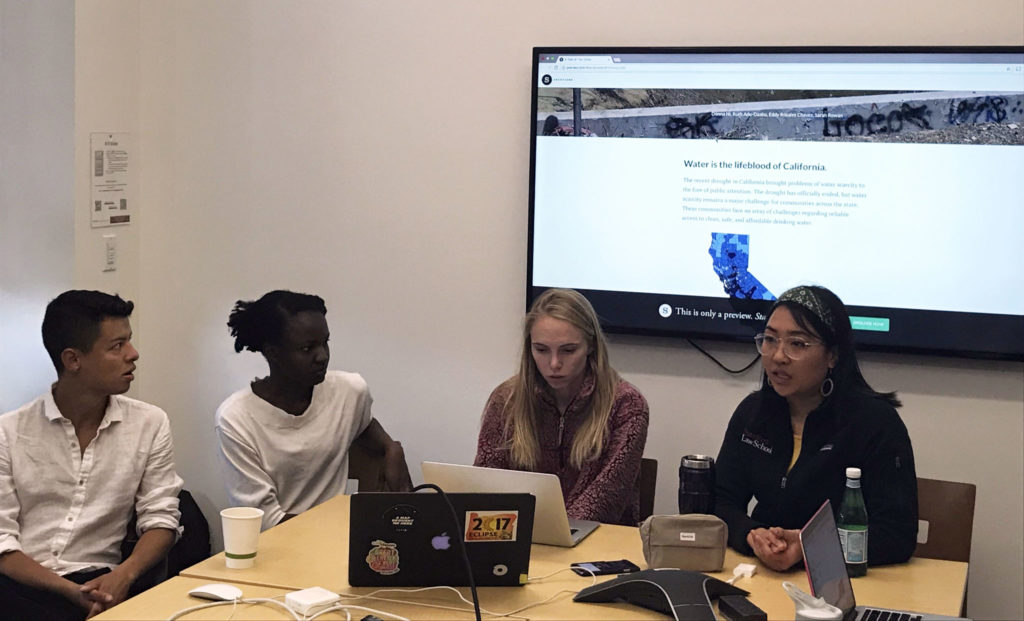
Building “Snow Fall” in 10 Weeks
“Snow Fall” ushered in a generation of scroll-based, mobile-friendly stories that finally achieved the harmonious juxtaposition of text and image – something that magazines and newspapers had already provided for a century.
Moreover, “Snow Fall” showed how interactivity and multimedia could carry the experience further through features like: evocative and atmospheric video “cinemagraphs” that set the scene at the top of each of the story’s six chapters; marginal multimedia widgets offering audio of 911 calls, explaining how airbags protect skiers during avalanches, introducing central characters to the story; and most significantly, giving a guided simulation of what precipitated the avalanche that killed three experienced back-country skiers and injured one more, and whose dynamics would determine who lived or died.
The story was justly praised for telling a harrowing tale, for exploring the dangers beneath the shiny surface of adventure sports, and advancing the storytelling medium. At the same time, it touched off a necessary debate about the limits of users’ attention spans and time budgets; the viability of stories that cost hundreds of thousands of dollars in reporting and production time; and which require a score of skilled journalists and technicians to produce.
Deconstructing “Snow Fall” and stories that have followed on and refined its approach, the course will delve into what we know about the relative strengths and limitations of audio, video, photojournalism, and infographics, and how they can be used together in the service of a narrative.
The course requires diving into the technical side of picture storytelling, video interviewing and field production; data and infographic journalism, including maps and geographic information systems, and finally, current tools and techniques for creating rich media articles.
From Maps to Meaning
D.School | Stanford University | Winter 2016
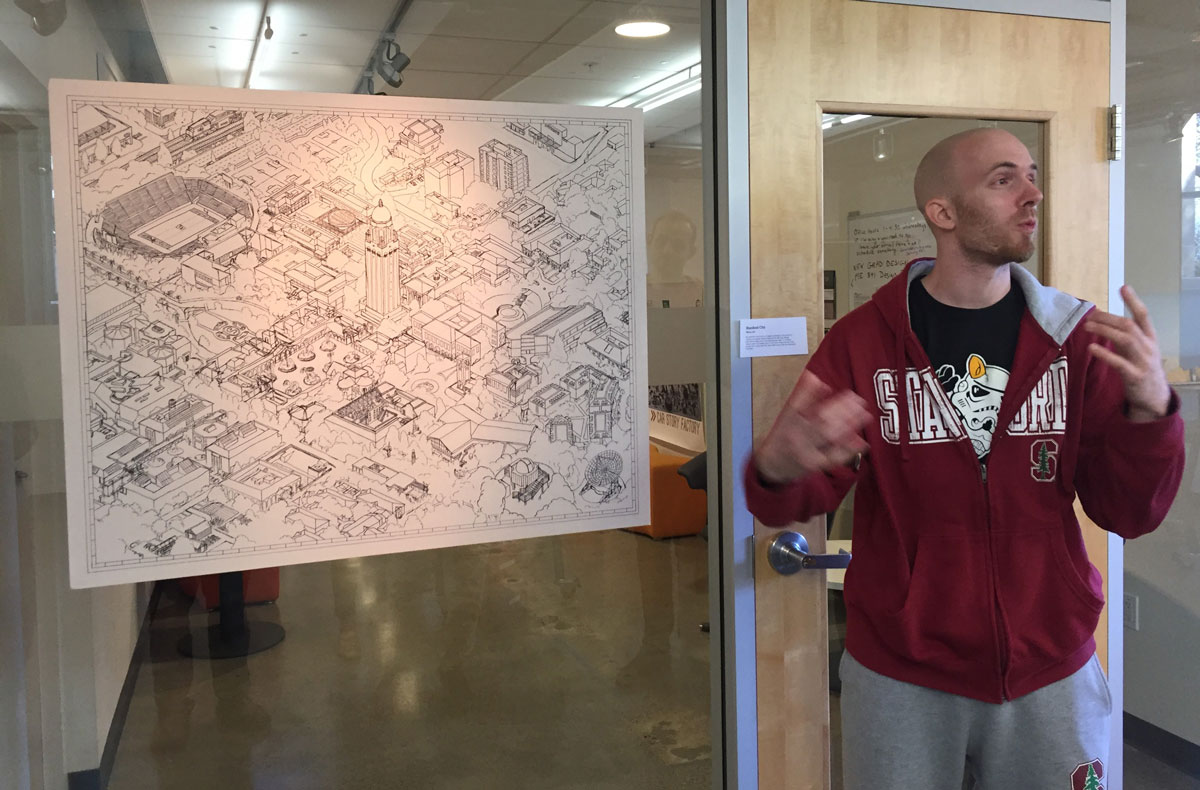
One of the oldest visual tools created by humans to make sense of the complexities of our world, maps are unique in their ability to synthesize data, convey meaning through spatial logic, and deliver information at high resolution. They are also incredible tools for communication, data sorting, and insight finding.
I contributed three sessions on interactive mapping and data visualization to this ten-week course taught by Carissa Carter and Tran Ha at the Stanford D.School.
Show, Don’t Tell Workshop
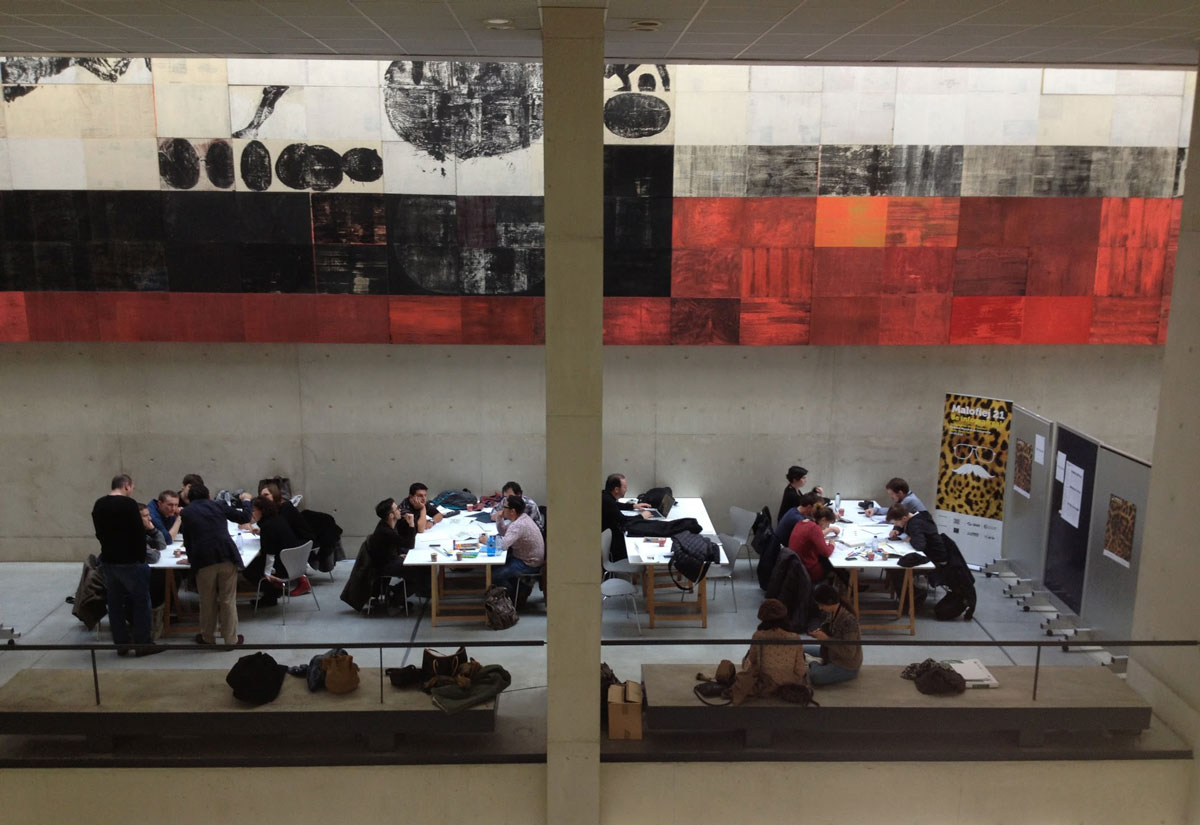
Malofiej World Infographics Congress | University of Navarre, Spain | 2004-2015