National Geographic
Data Points Blog
I was the lead writer for National Geographic’s first data blog in 2015. I explored maps and data visualization as applied to science and environmental topics.
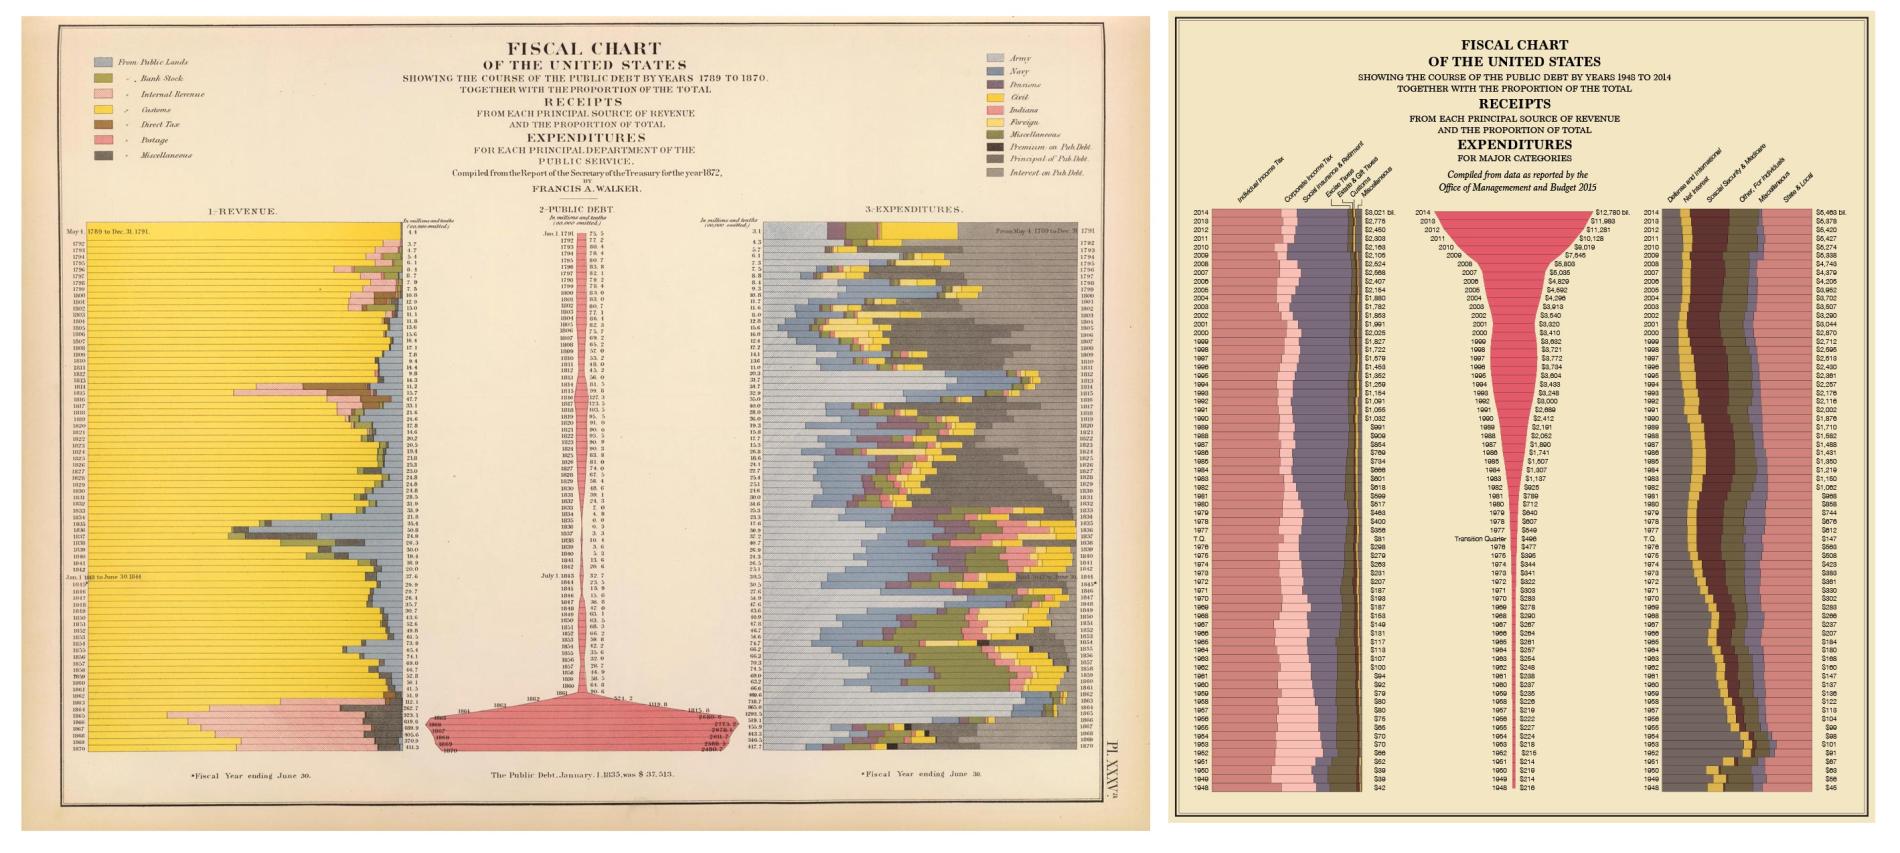
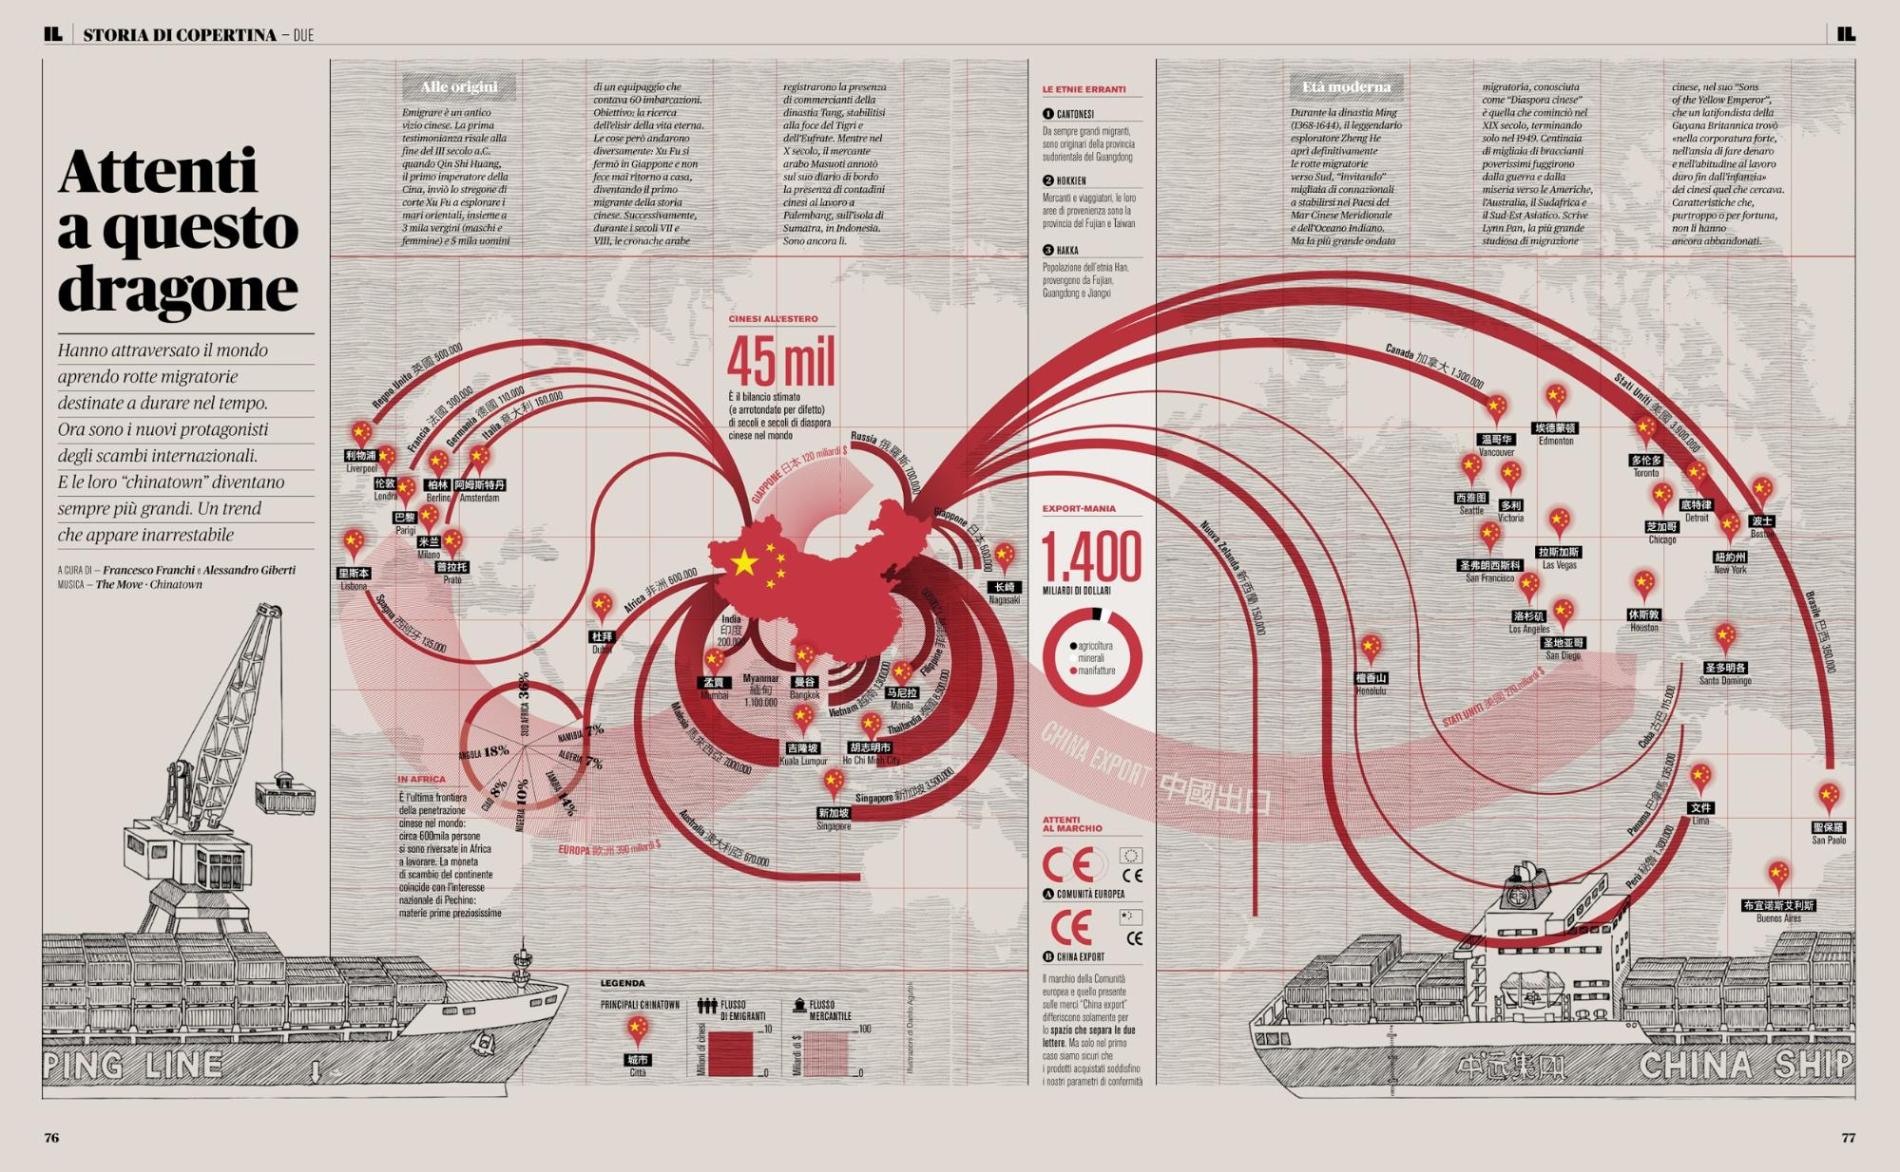
“Steampunk” Infographics Beautifully Combine Past and Present
When information graphics designers also look to the past for inspiration, the result – something I'll call "steampunk infographics" – tells us a lot about the past and present of information visualization.
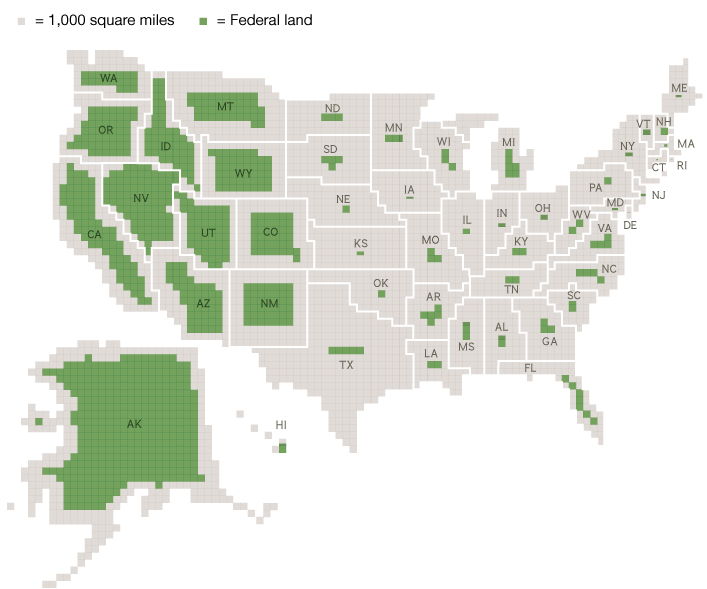
Public Lands, Public Data: Making Sense of Climate Change
In a new report, a former federal official says the government needs to make better tools for visualizing the impacts of climate change.
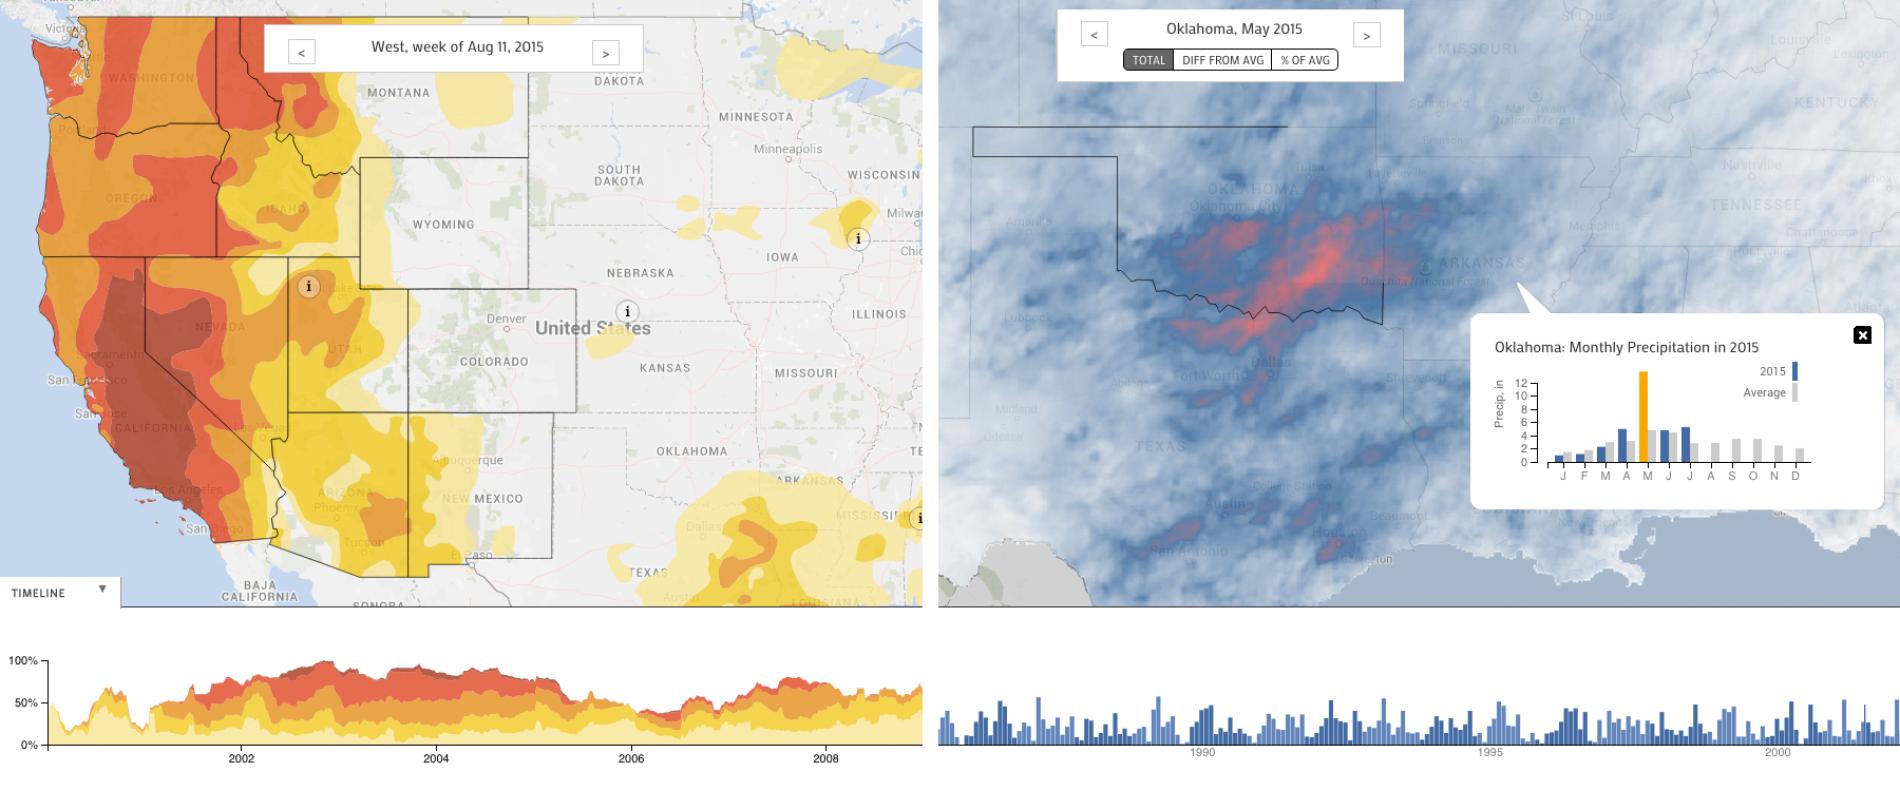
Visualizing a Wet, Hot (and Also Very Dry) American Summer
Interactive maps of drought and precipitation show that U.S. weather in 2015 is a study in contrasts.
People-Powered Data Visualization
Through crowdsourcing and citizen science projects, the general public is making profound contributions to research. Can data visualization help make sense of this wealth of new information?
Watch Western Wildfires Burn After Years of Drought
A new interactive map shows how wildfires have ravaged the western United States in 2015 – and over the past decade.
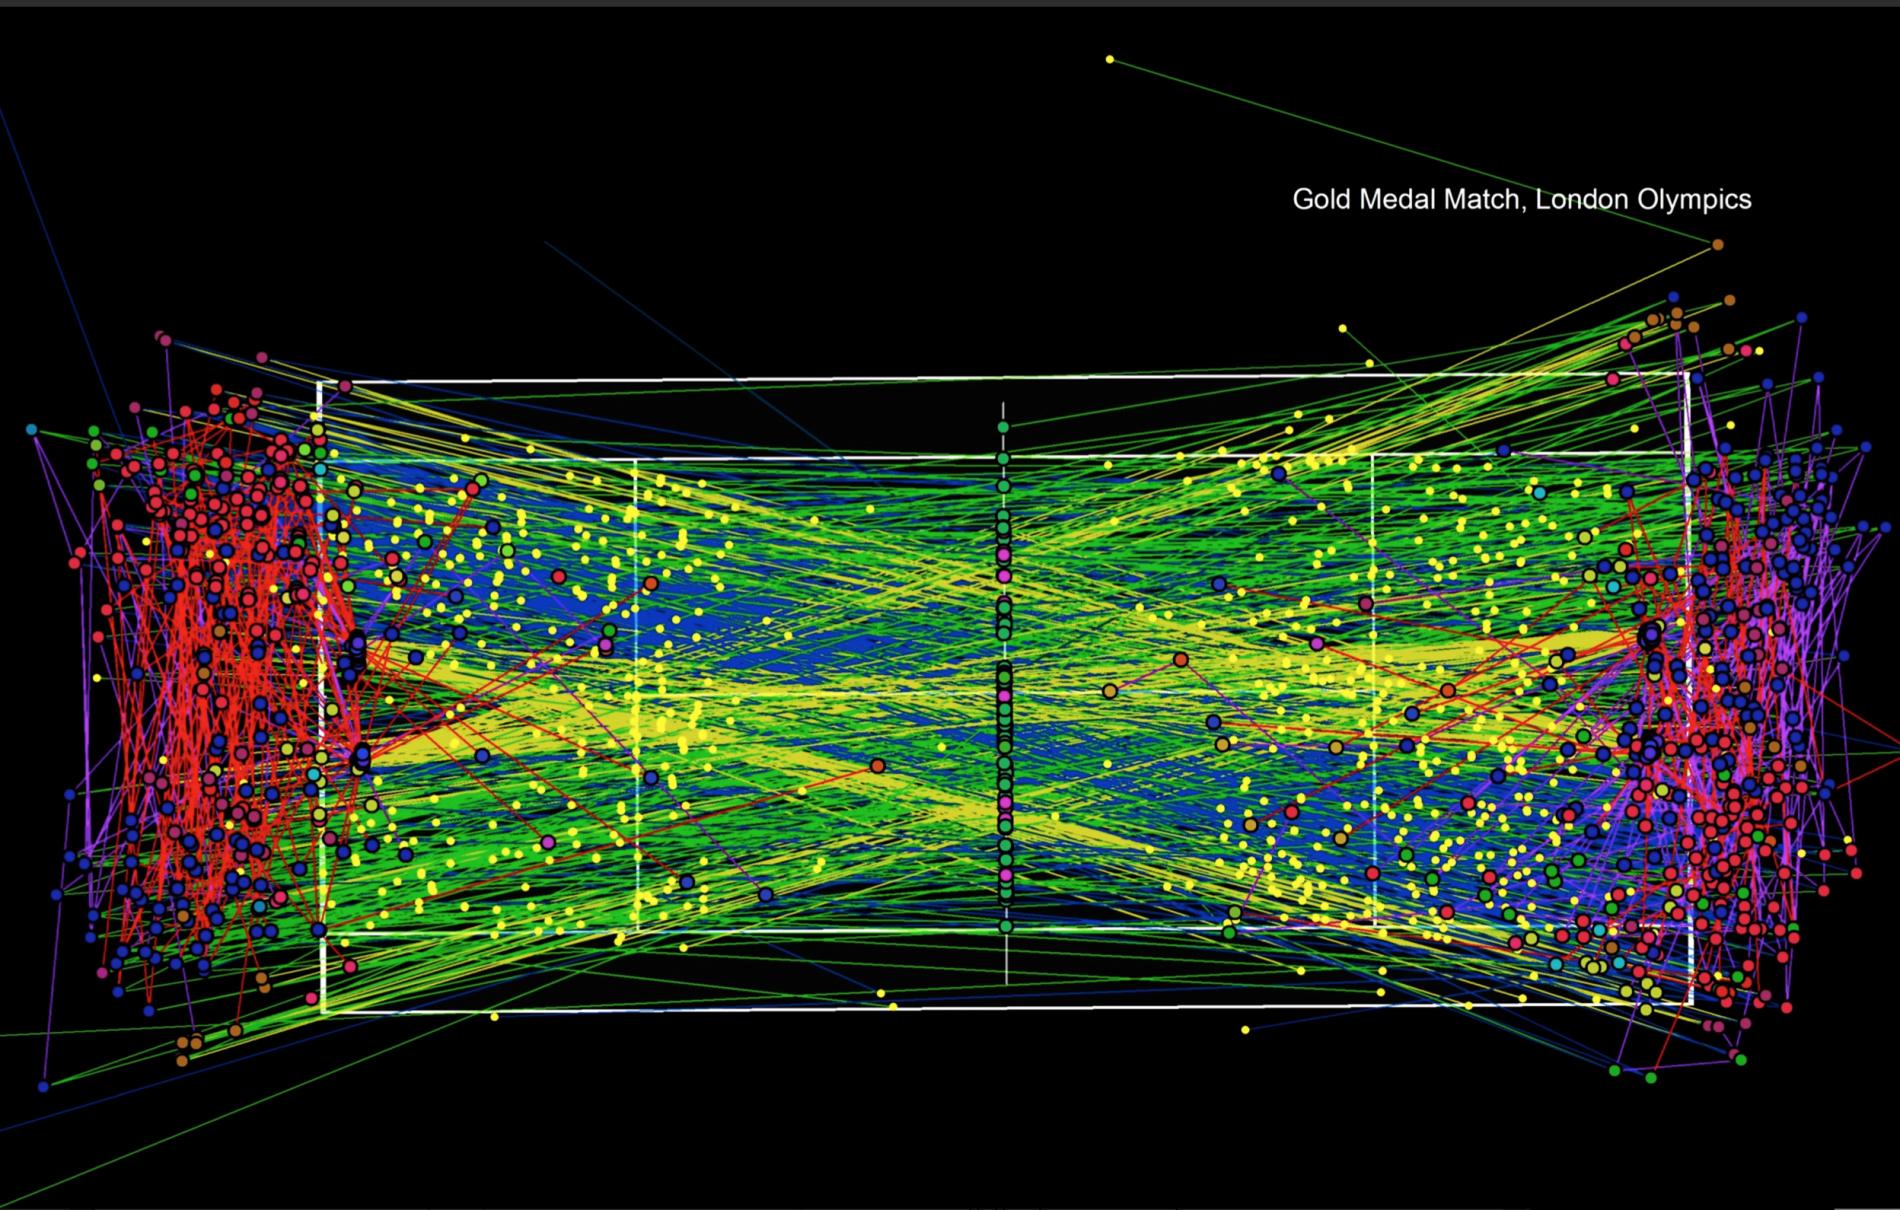
Using Maps and Data Vis to Understand Tennis
These striking visualizations of tennis matches show what we can learn from sports tracking data.
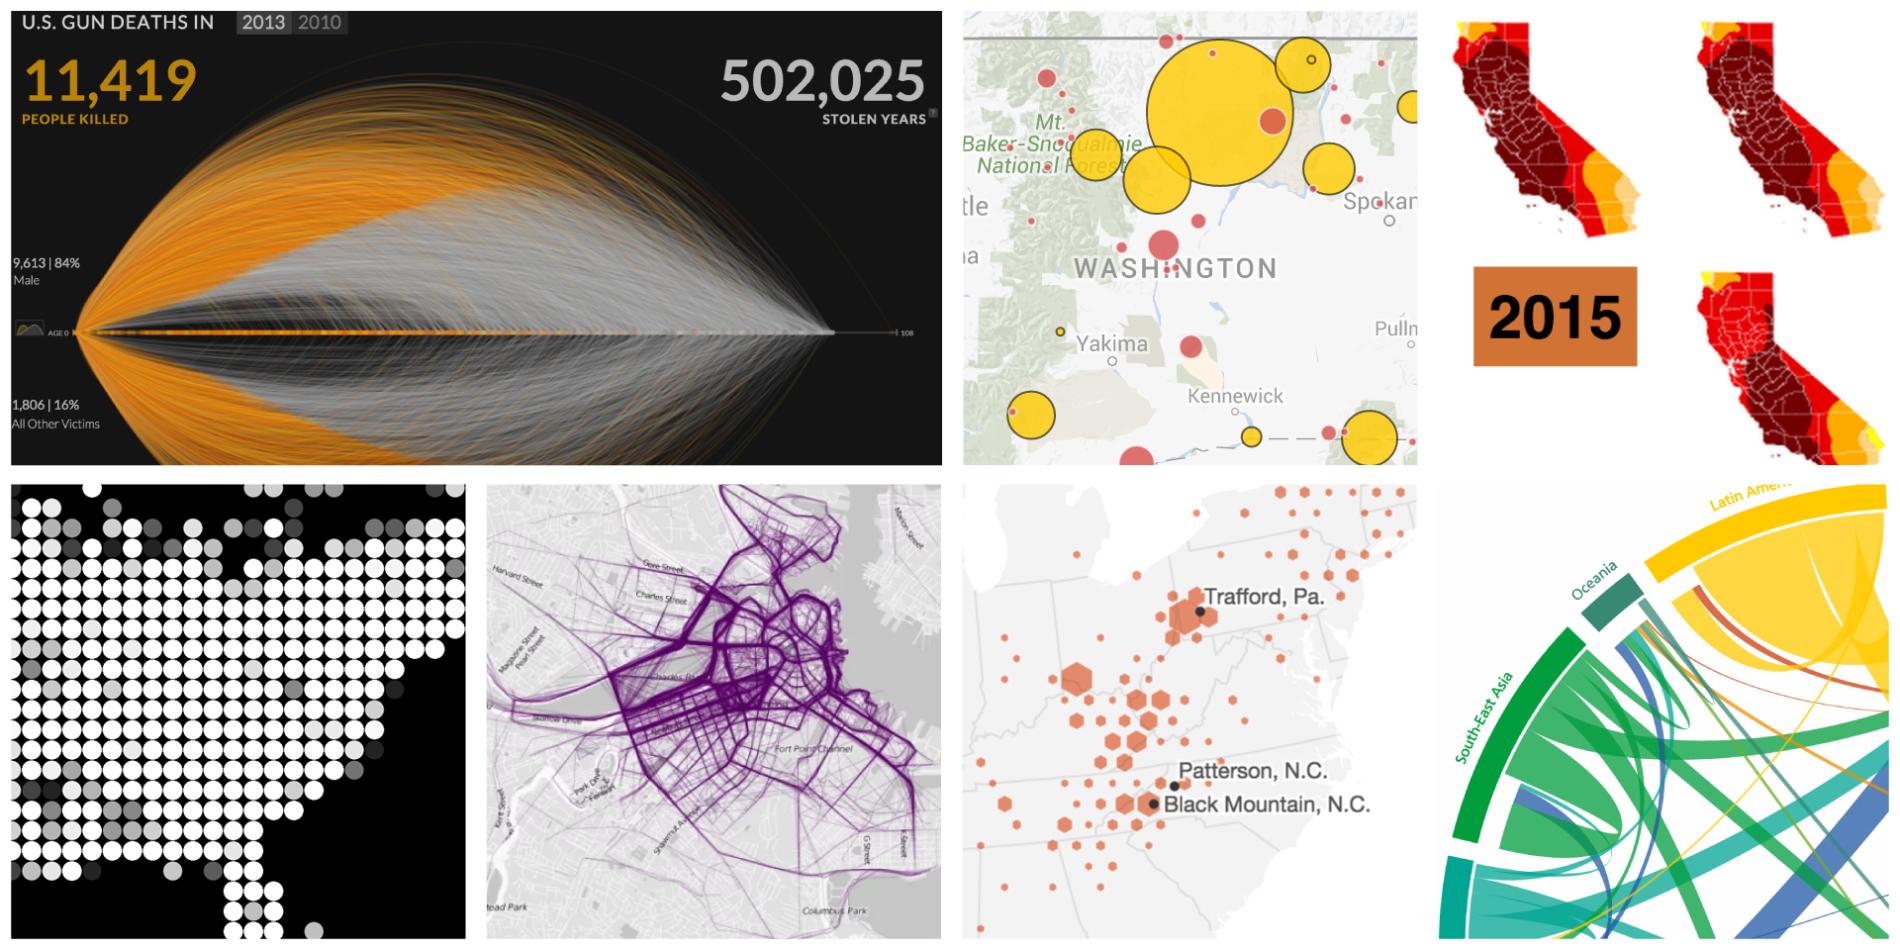
Taking Data Visualization From Eye Candy to Efficiency
Sophisticated data visualizations are pushing the bounds of what we can process, sometimes to the breaking point. What are the signature styles of contemporary data vis, and will they stand the test of time?
The “Rules” of Data Visualization Get an Update
What are the rules of data visualization, a practice that draws on research into cognitive theory, graphical perception, statistics and journalism? The journalist and educator Alberto Cairo helps tie together many fields of study into easy-to-follow guides to data visualization and information graphics.
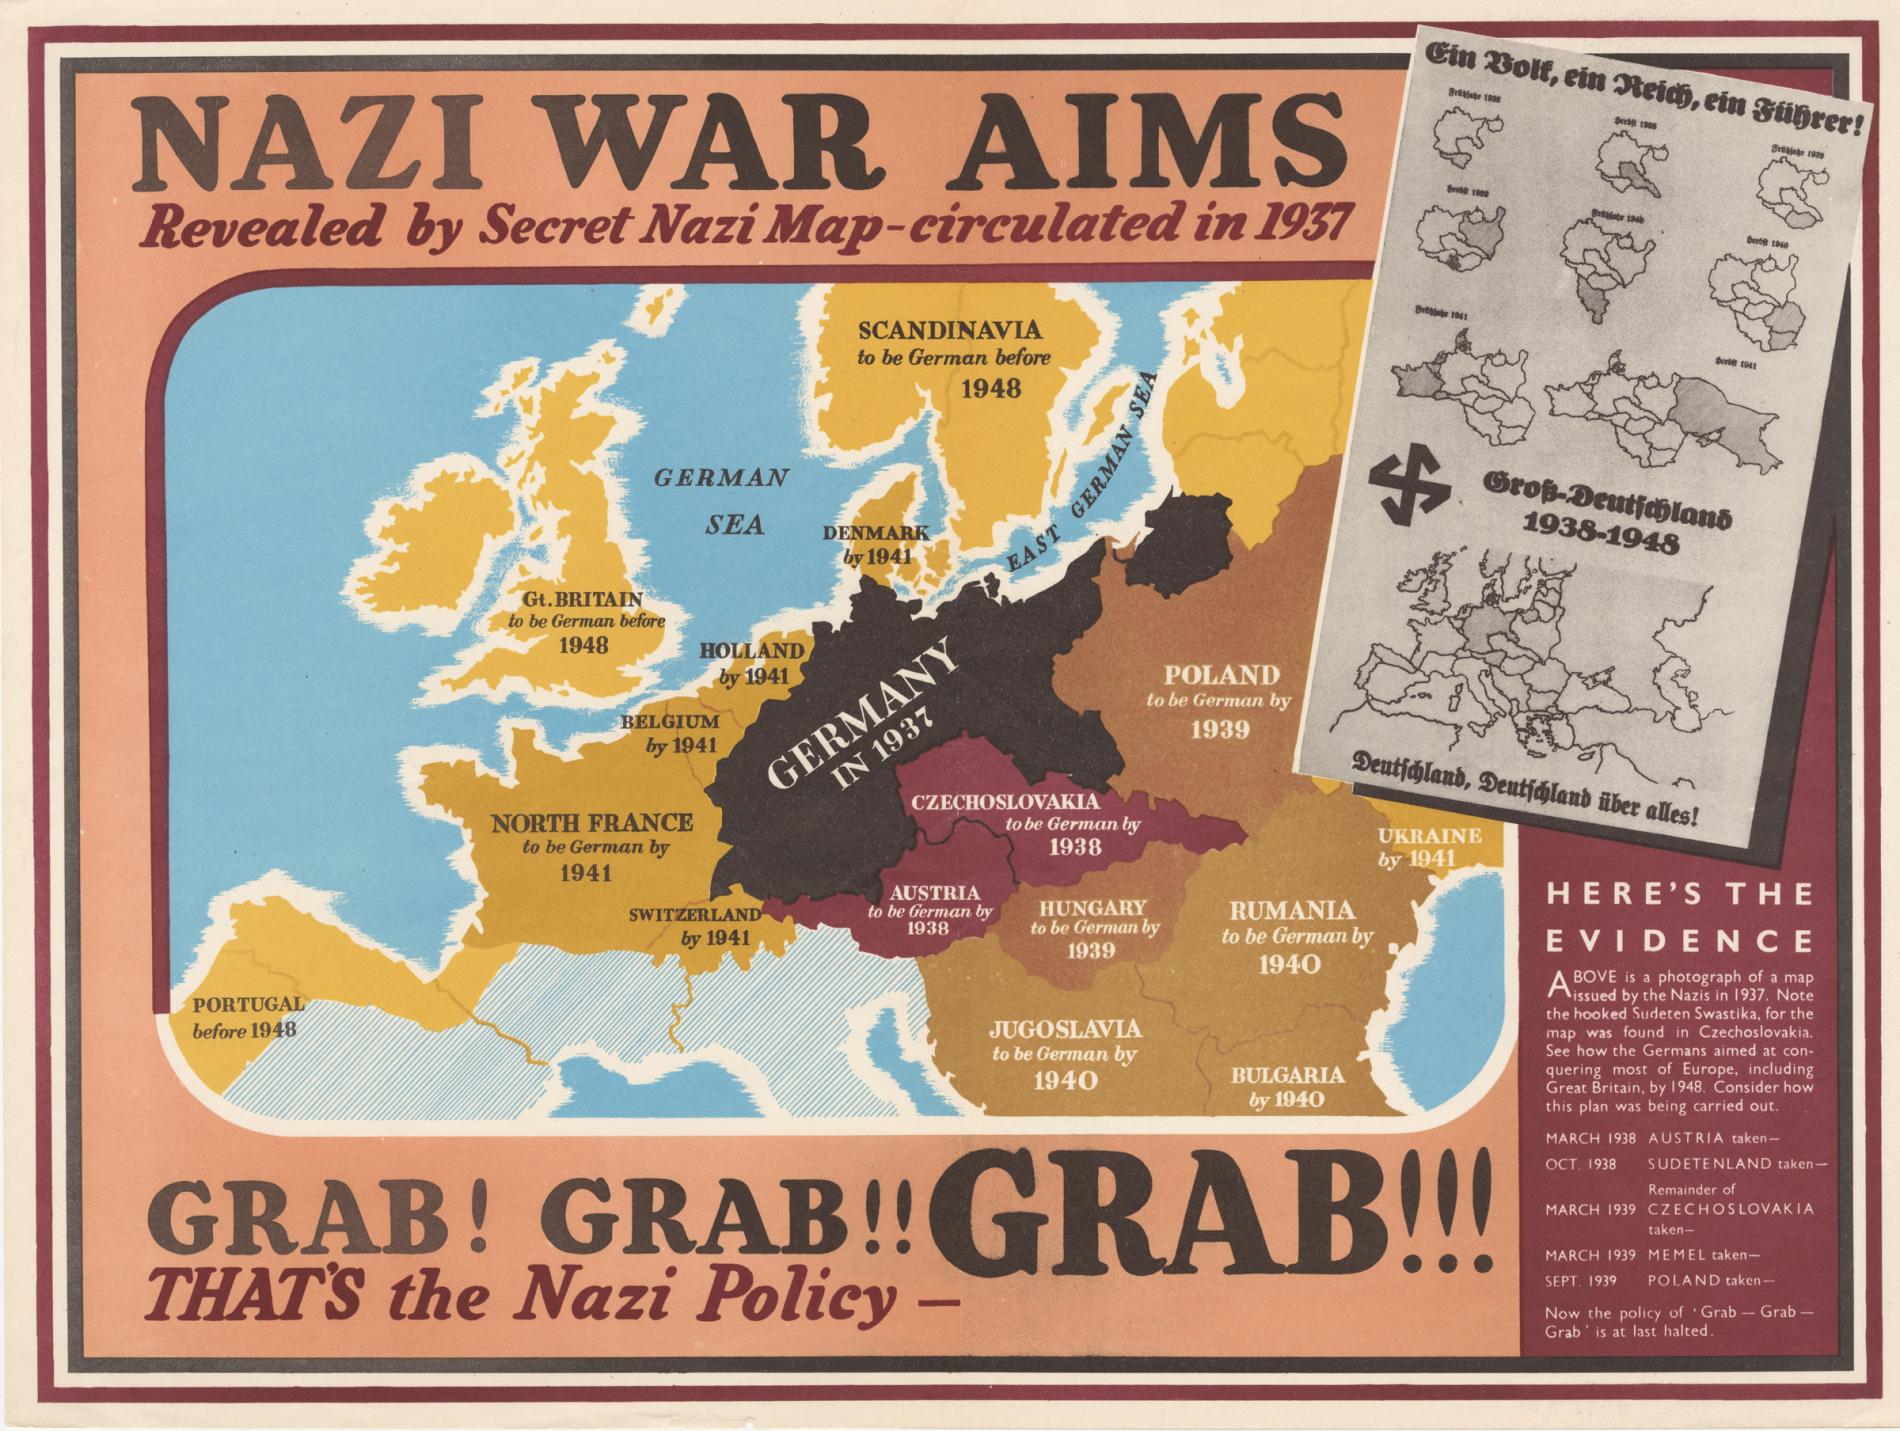
How to Make Maps and Influence People
Maps are one of the most trusted forms of communication – which makes them a great for getting your point across. A look at the dark art of cartographic persuasion.
European Journalism Centre
Data Journalism Handbook
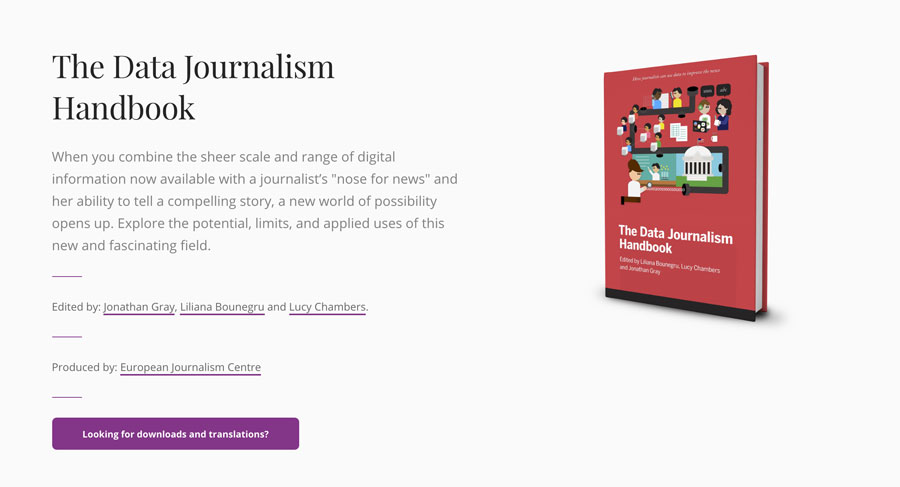
Using Visualizations to Tell Stories
Data Journalism Handbook, Aug. 2012
Data visualization merits consideration for several reasons. Not only can it be strikingly beautiful and attention getting — valuable social currency for sharing and attracting readers – it also leverages a powerful cognitive advantage: fully half of the human brain is devoted to processing visual information. When you present a user with an information graphic, you are reaching them through the mind’s highest-bandwidth pathway. A well-designed data visualization can give viewers an immediate and profound impression, and cut through the clutter of a complex story to get right to the point.
Note: misattributed to Sarah Cohen
Designing with Data
Data Journalism Handbook
While sometimes data vis is very effective at taking familiar information and showing it in a whole new light, what happens when you have brand-new information that people want to navigate? The age of data brings with it startling new discoveries almost every day, from Eric Fischer’s brilliant geographic analyzes of Flickr snapshots to New York City’s release of thousands of previously confidential teacher evaluations.
Note: misattributed to Brian Suda
Water in the West Project, Stanford University
Understanding California’s Groundwater
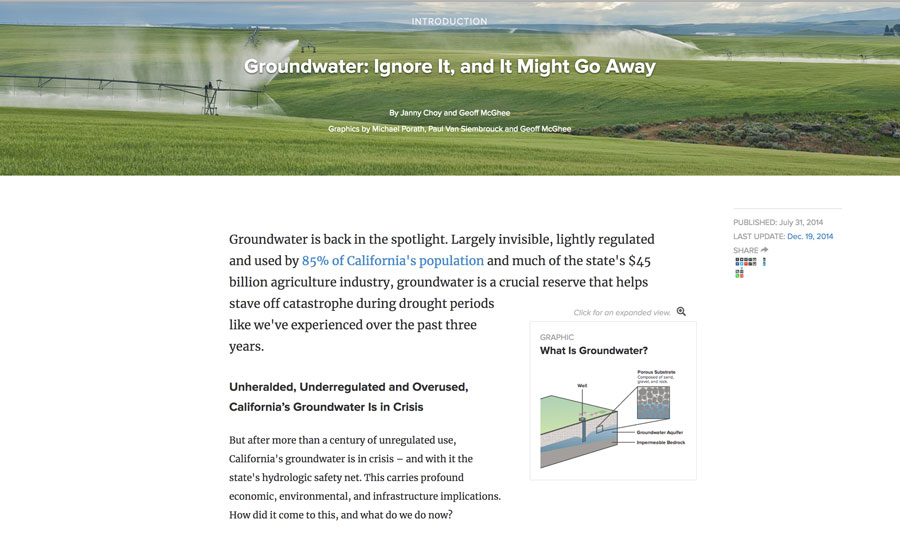
Groundwater: Ignore It, and It Might Go Away
Water in the West, Stanford University, August 2014
Groundwater is a crucial resource for Californians in both good times and bad, but it has been chronically depleted in many areas. This overview explores problems surrounding groundwater use and potential ways to address them.
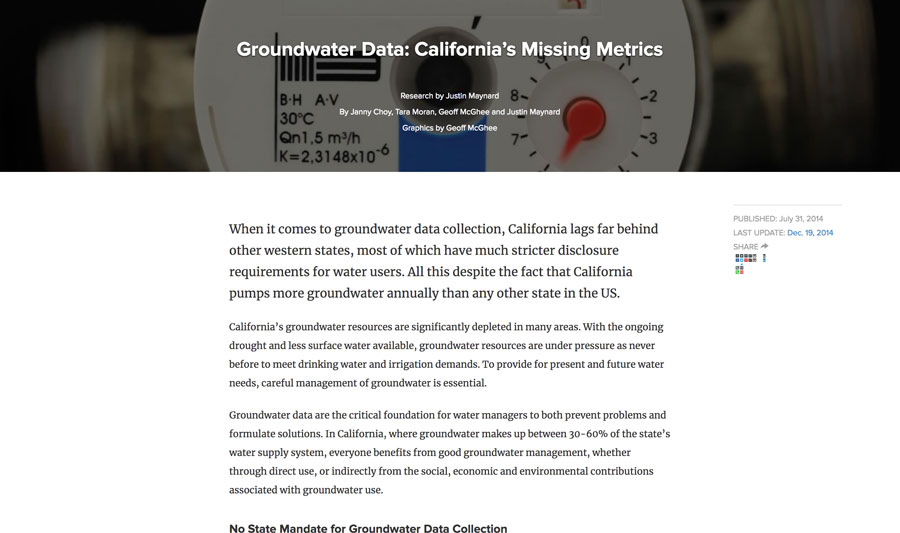
California’s Missing Metrics
Water in the West, Stanford University, August 2014
Despite leading the nation in groundwater use, California lags far behind other Western states in collecting and sharing data. Research by Water in the West looks at five key metrics that are critical to managing groundwater in California and assesses how widely they are collected and shared across the state.
Rural West Initiative, Stanford University
Report: Community Journalism in the United States
Did the West Make Newspapers, or Did Newspapers Make the West?
The Rural West Initiative
The history of newspapers in the rural West is one of crisis and triumph in alternation. Failure, and bouncing back from it, has been a tradition. And at a time when there is so much talk about the future of newspapers, this past is worth considering.
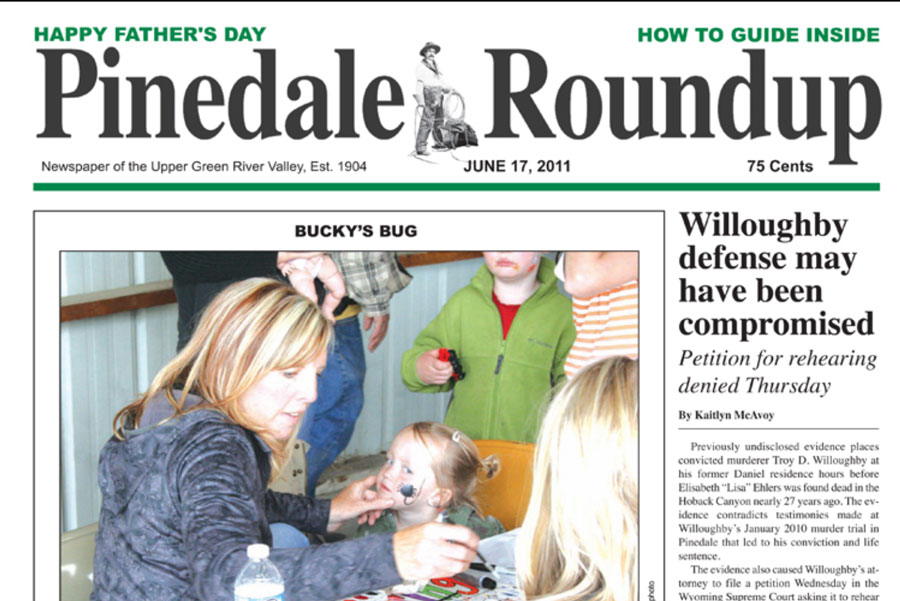
Rural Papers Doing Better Than Their City Counterparts
High Country News, July 5, 2011
Rural journalism is surviving, even thriving, in the rural West and across the United States, in an era of precipitous decline for major metropolitan newspapers. In the United States, some 7,500 community newspapers--papers with under 30,000 in circulation--still hit the streets, front porches, and mailboxes at least once a week.
Rural West Initiative, Stanford University
Bridging the Distance: Common Issues of the Rural West
In 1909, President Roosevelt’s Country Life Commission warned of difficulties in rural America that were hastening migration to the nation’s growing cities, problems with health care, schools, roads, and access to modern conveniences like indoor plumbing.
Due to grassroots efforts, federal government intervention, and improvements in technology, the decades to come would bring a dramatic rise in living standards, as roads, dams, telephones, and electricity reached deep into the American countryside—even into the rugged mountain, forest, and desert reaches of the rural West. The region is still remote, but airports, highways, television, radio, and telecommunications services have bound it more closely than ever to the rest of the nation.
However, in the early decades of the Internet age, a new technological divide may be returning a measure of economic and social isolation to rural communities across the western United States: the lagging expansion of high-speed online access into rural areas.
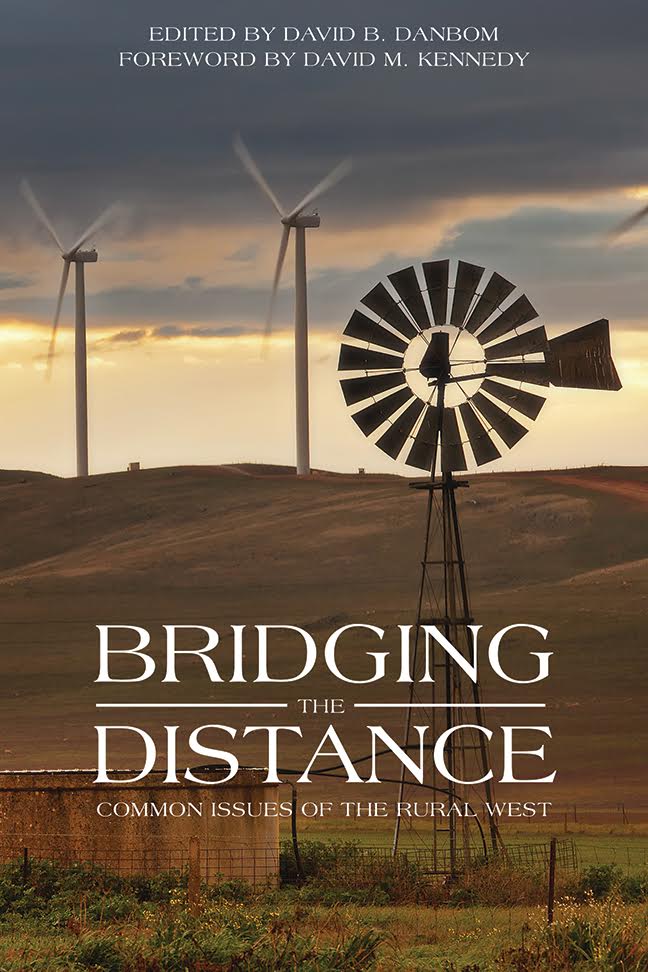
Chapter in “Bridging the Distance: Common Issues of the Rural West,” October 2015, 6,800 words