Infographics, maps, and interactive data visualizations
Information graphics, or infographics, are pictures made narrative. Drawing together data visualization, mapping, technical illustration, photography, and textual annotation, they help crystallize meaning. Infographics were refined by newspaper and magazine editors over many decades during their industry's heyday, and many of their basic principles predate the online world.
Along with many of my peers, I spent years exploring how to and interactivity into infographics, and the possibilities were fascinating. But over time, as newsroom resources dwindled, and the digital experience fragmented into many types and sizes of screens – mobile, tablet, PC, not to mention paper – we came back to the understanding that for infographics, what you see at the first glance is the most important.
Canary Media
The huge climate problem of cement, steel and chemicals, visualized
These three materials are essential, carbon-intensive and produced in mind-bogglingly large quantities.
The Nature Conservancy, Groundwater Leadership Forum and research in Nature Communications
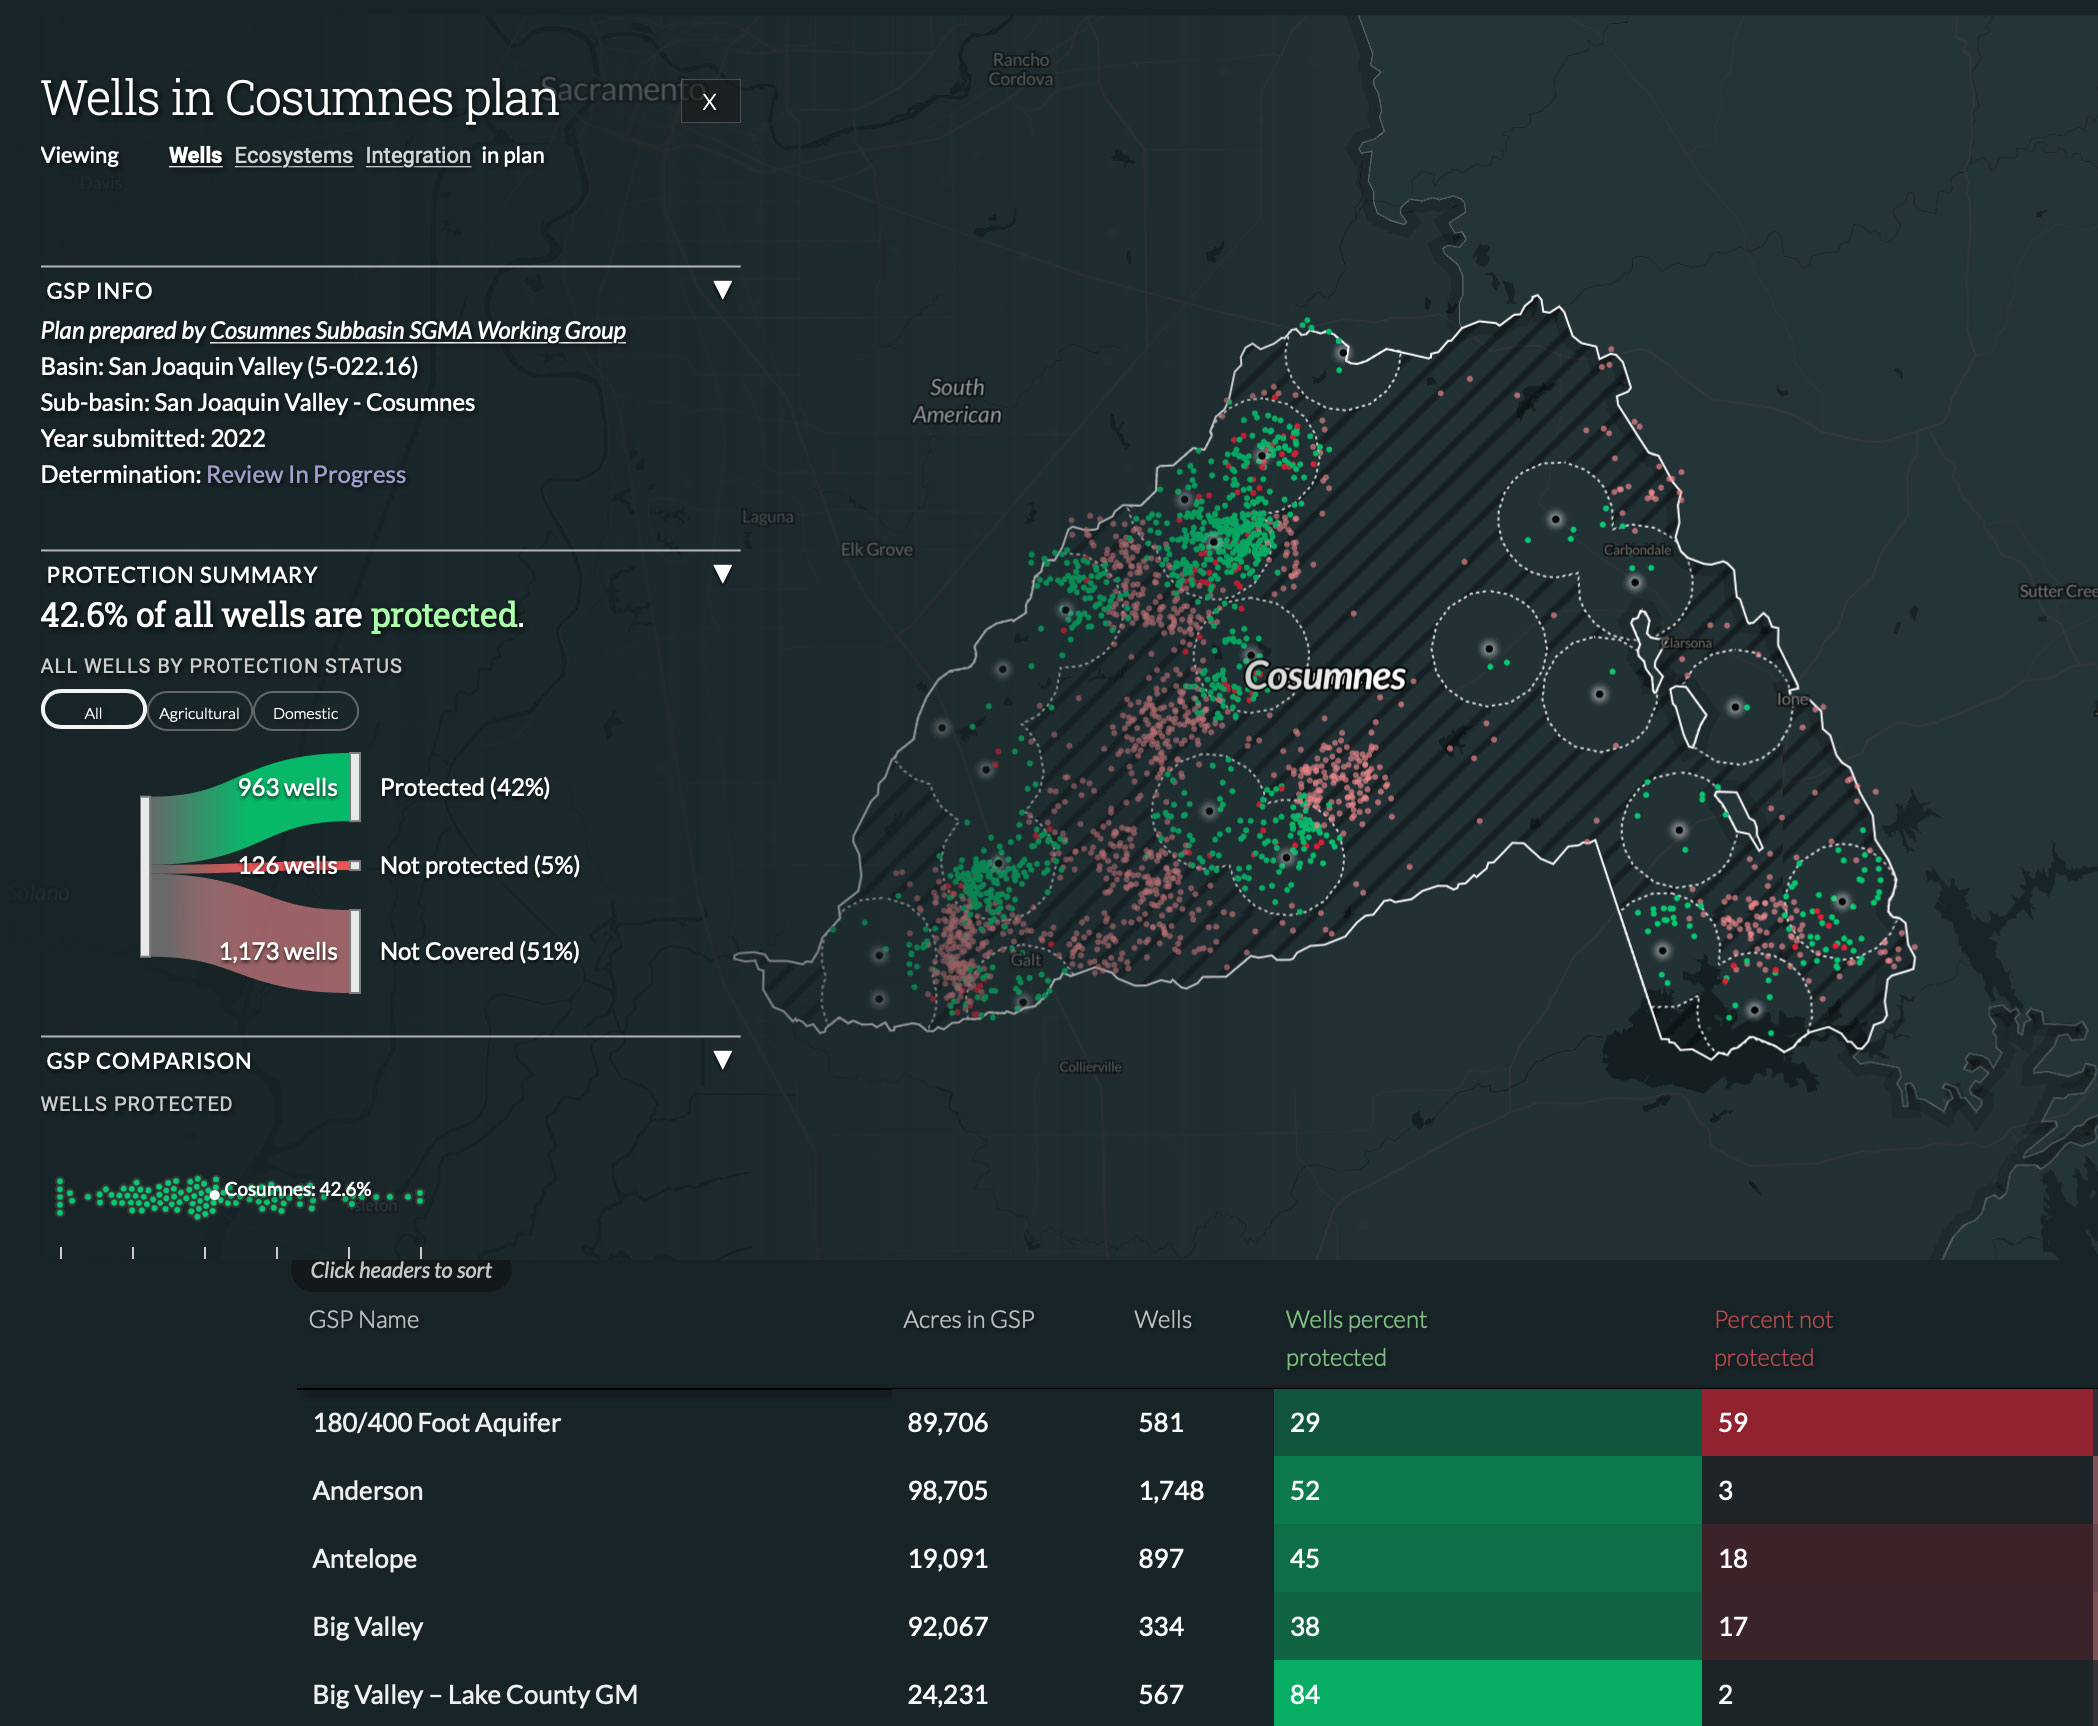
Is SGMA Working?
Groundwater sustainability plans are failing many users in California.
Canary Media
LNG export boom runs up against climate goals
The U.S. is about to become the global leader in exports of liquefied natural gas, or LNG. What does that mean for the climate?
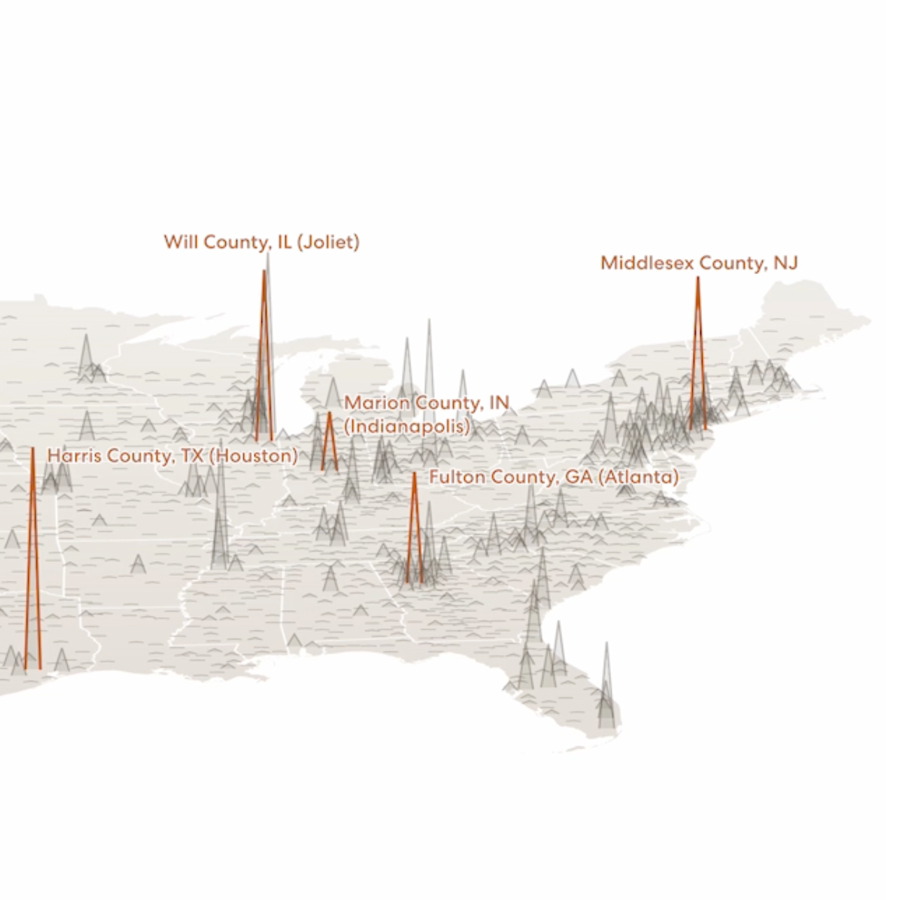
Sierra Magazine
Free Shipping Isn’t Free for Everyone
Online retailing delivers a public health problem.
Sierra Magazine
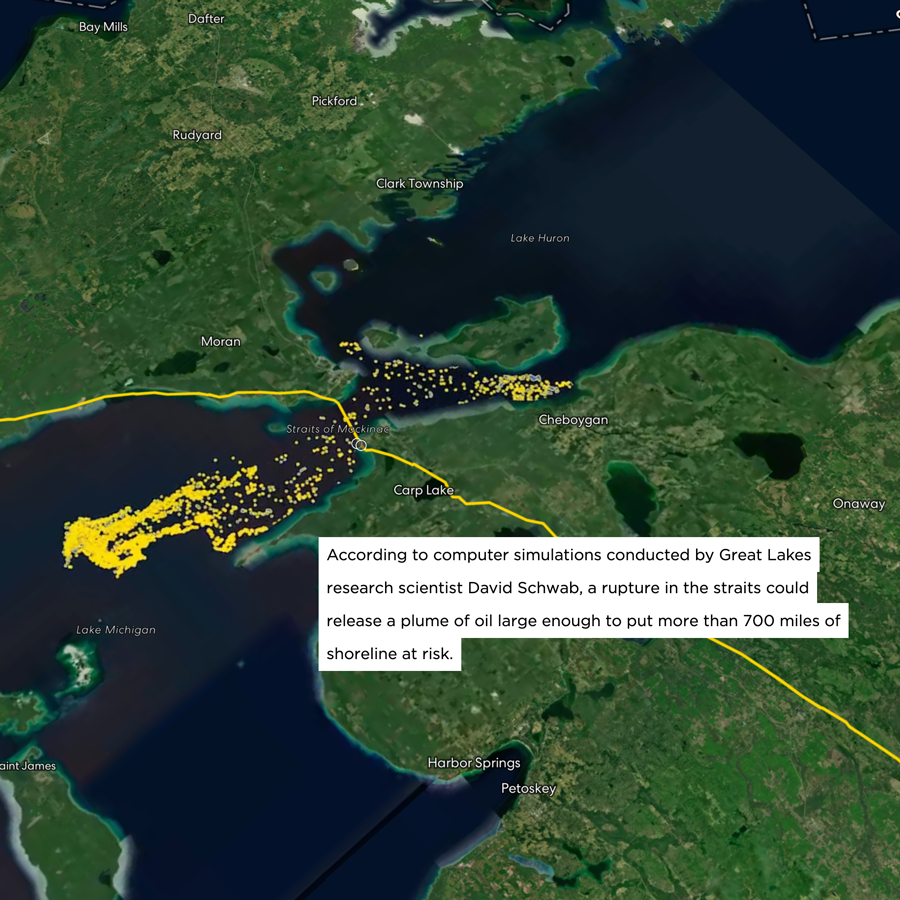
A Battle for the Future of the Great Lakes
A pipeline carrying Canadian tar sands crude has already leaked a million gallons. These are the resisters dedicated to shutting down Enbridge Line 5.
Global Fishing Watch
Hotspots of Unseen Fishing Vessels
Examining the intentional disabling of automatic identification system devices across commercial fisheries.
Global Fishing Watch
New Techniques Reveal Fishing Vessel Identities in the Dark of Night
Merging nighttime images with GPS datasets to observe vessels not broadcasting their positions.
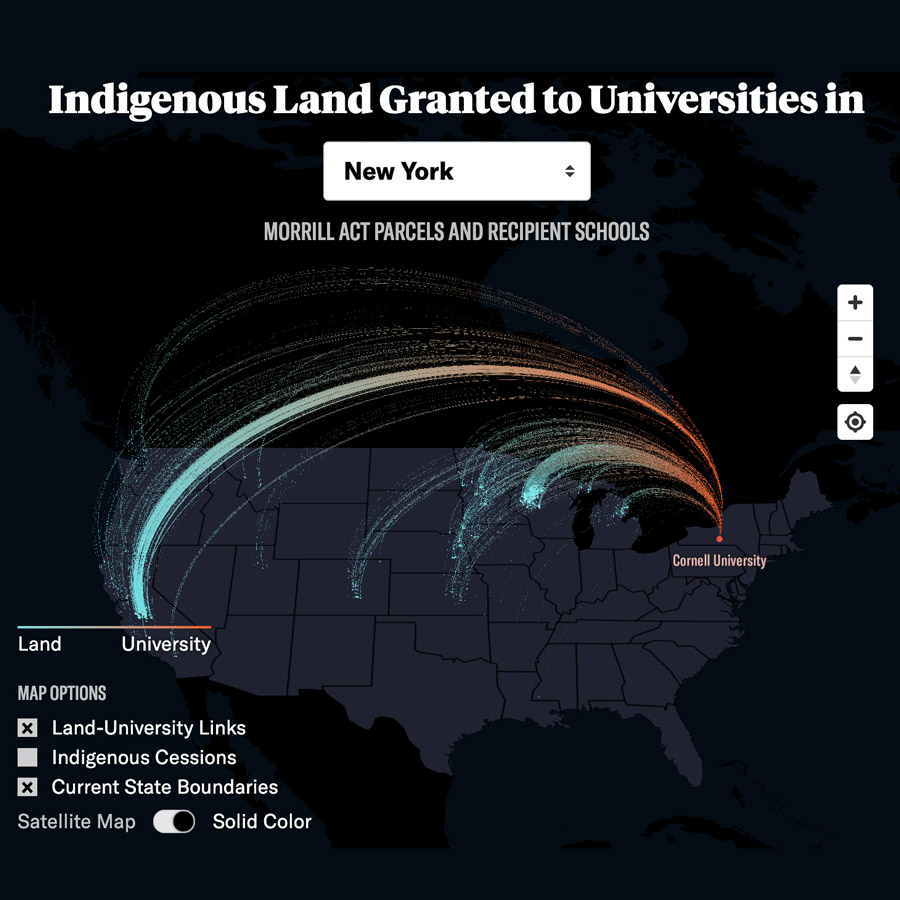
High Country News
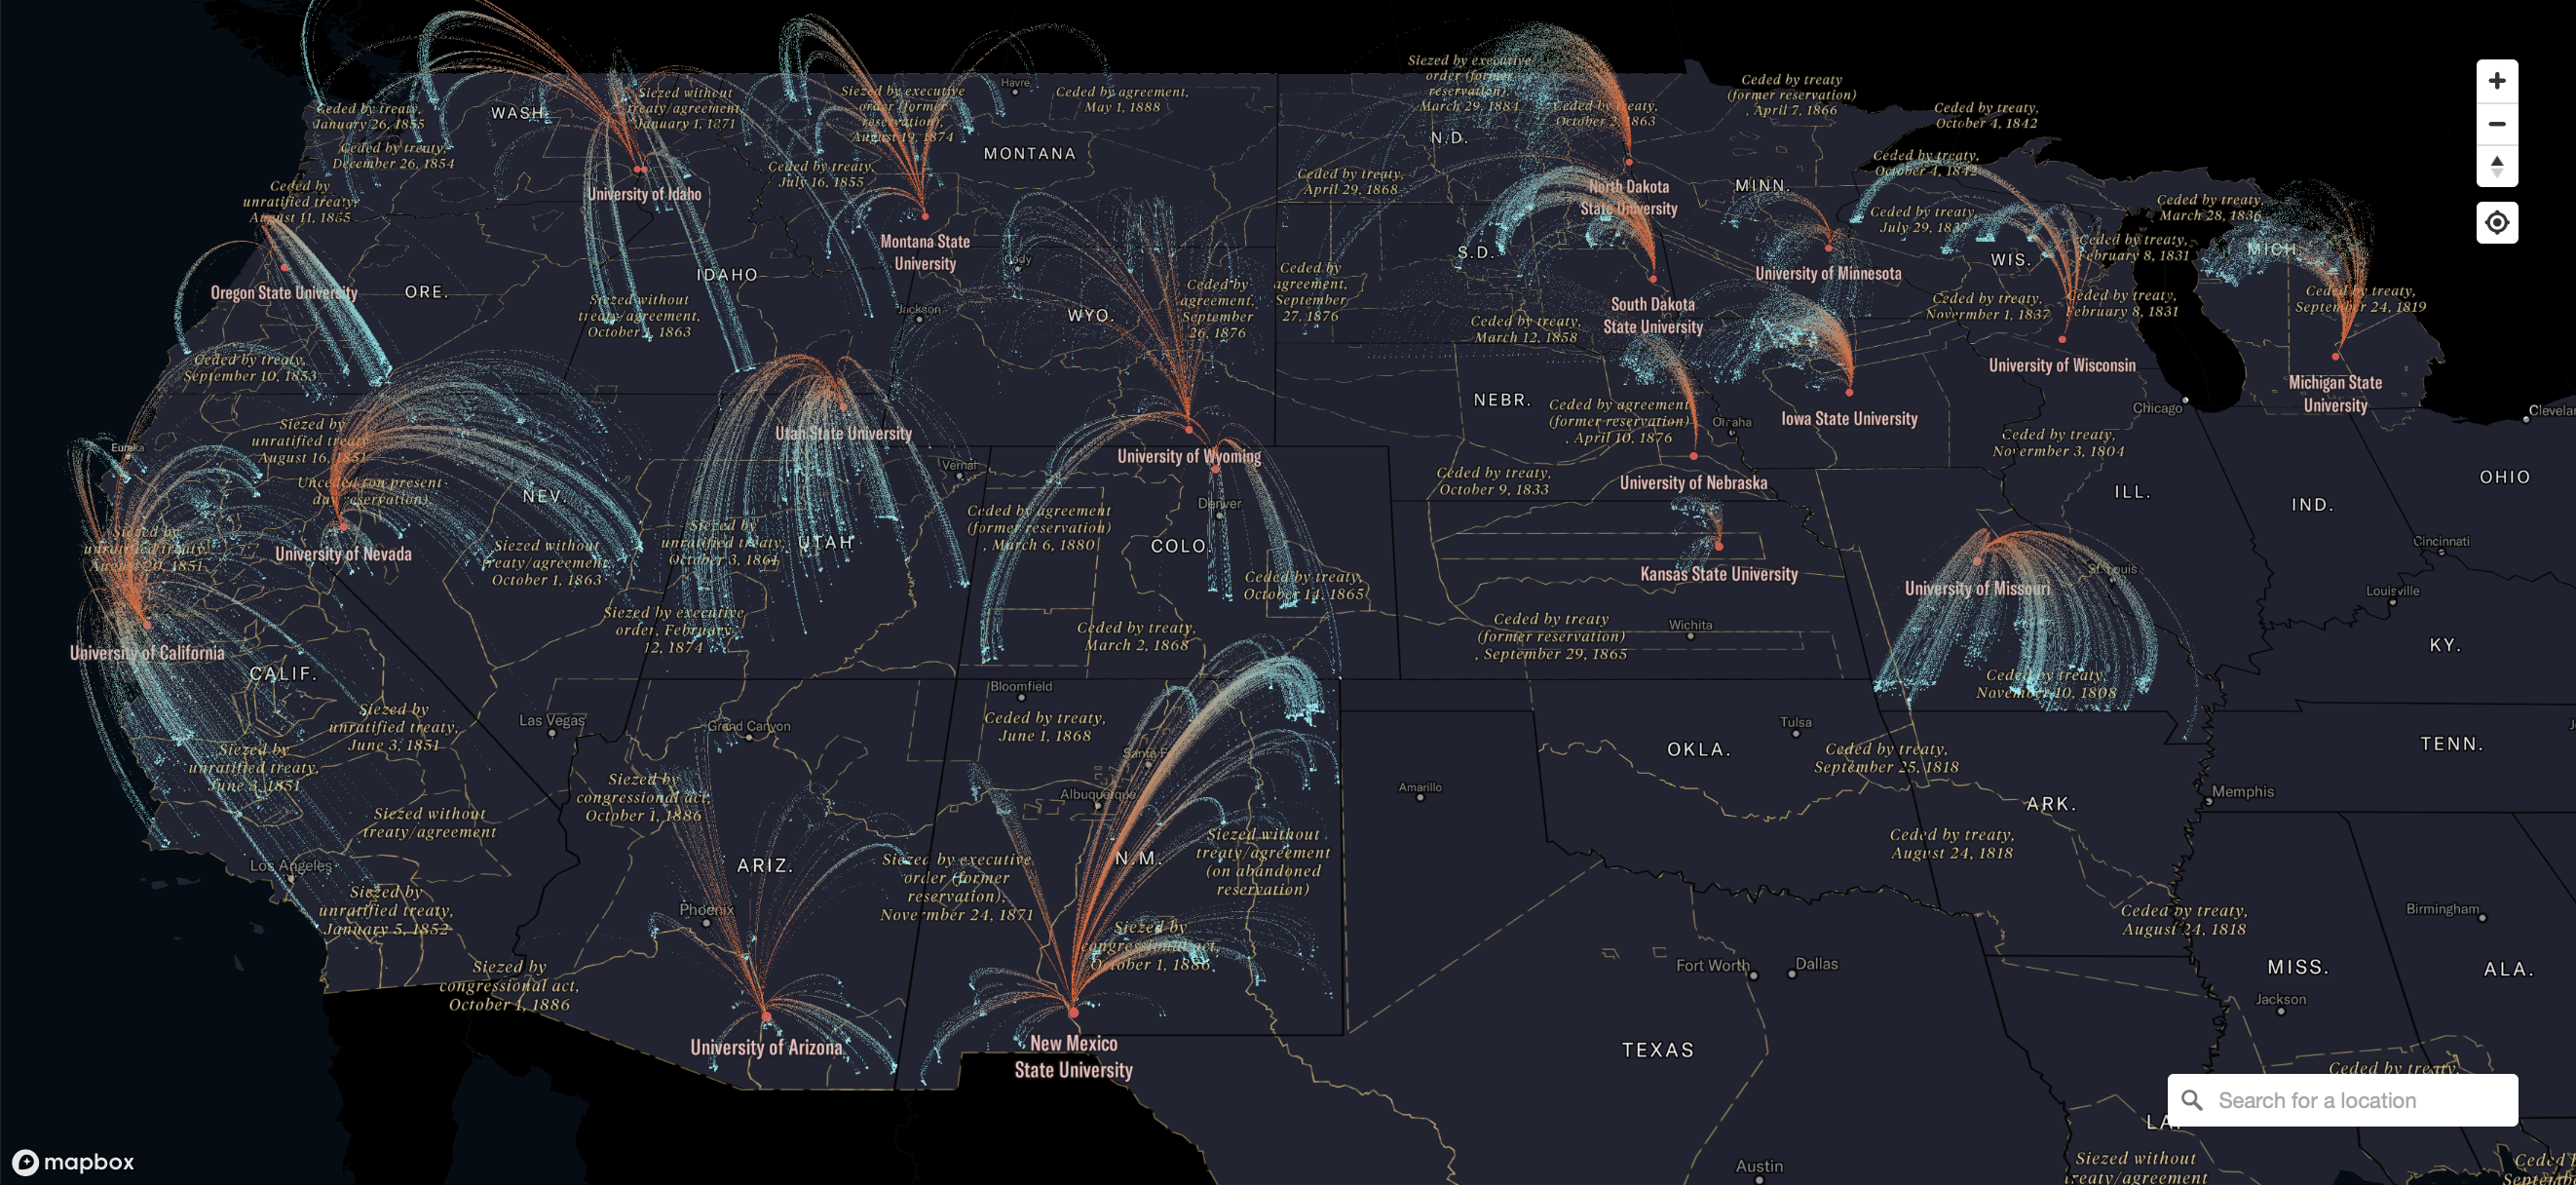
Land-Grab Universities
Nearly 11 million acres of Indigenous land. Approximately 250 tribal nations. Over 160 violence-backed treaties and land seizures. Fifty-two universities. Discover the bloody history behind land-grant universities. Web application for High Country News investigative deep dive.
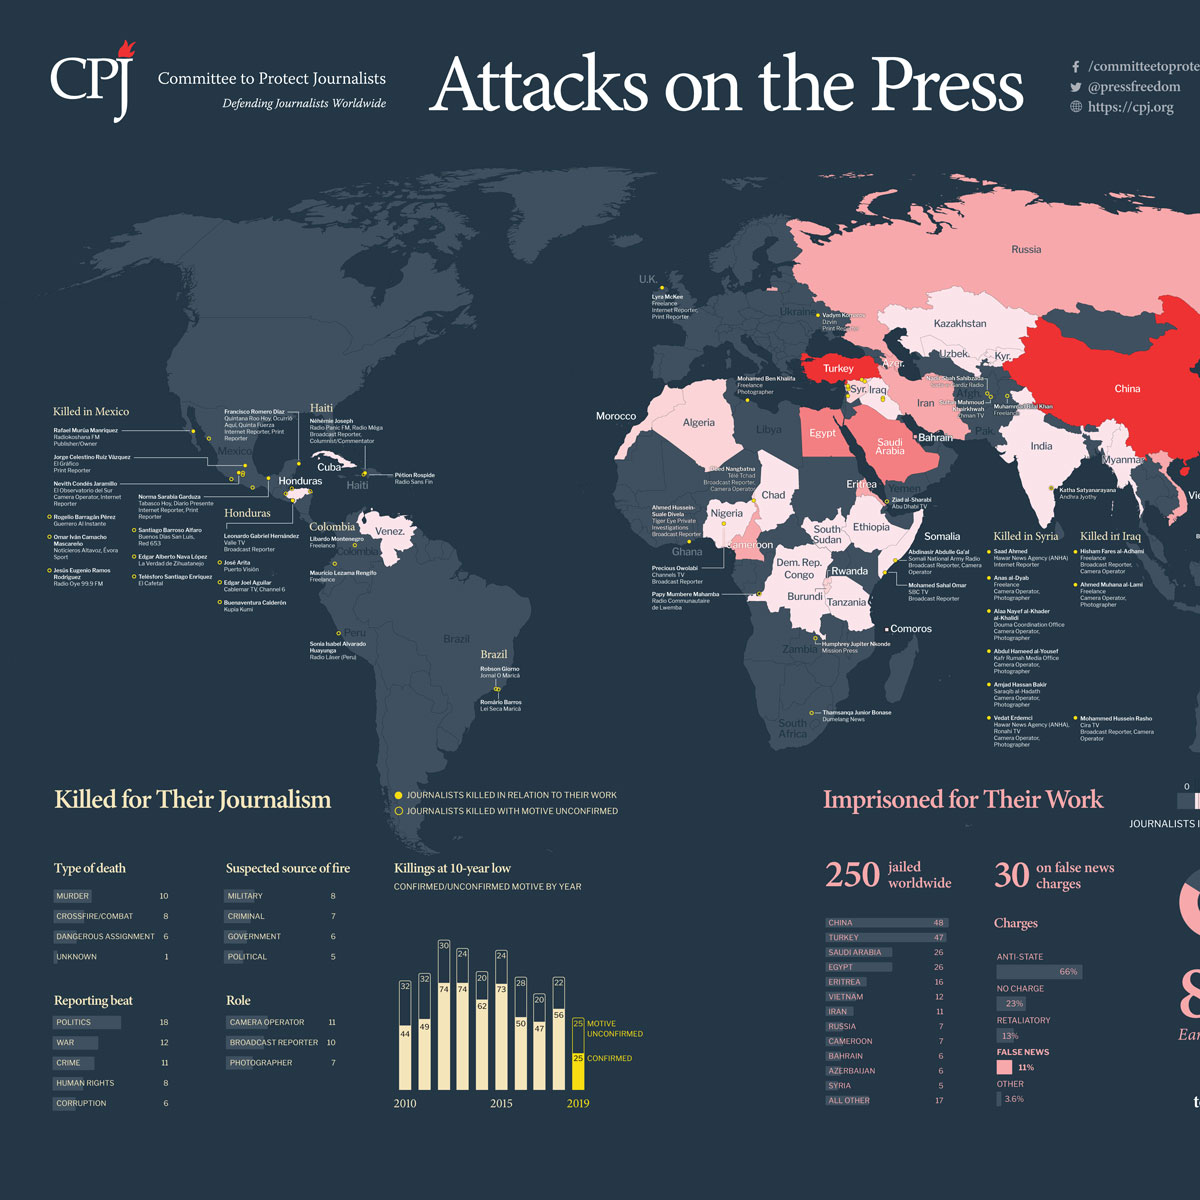
Committee to Protect Journalists
Attacks on the Press (2019-2022)
I worked with the committee to develop its annual visual reports on a grim but vital issue: the hundreds of journalists who gave their lives or their freedom in pursuit of the truth:
- 2022 report
- 2021 report
- 2020 report
- 2019 (print)
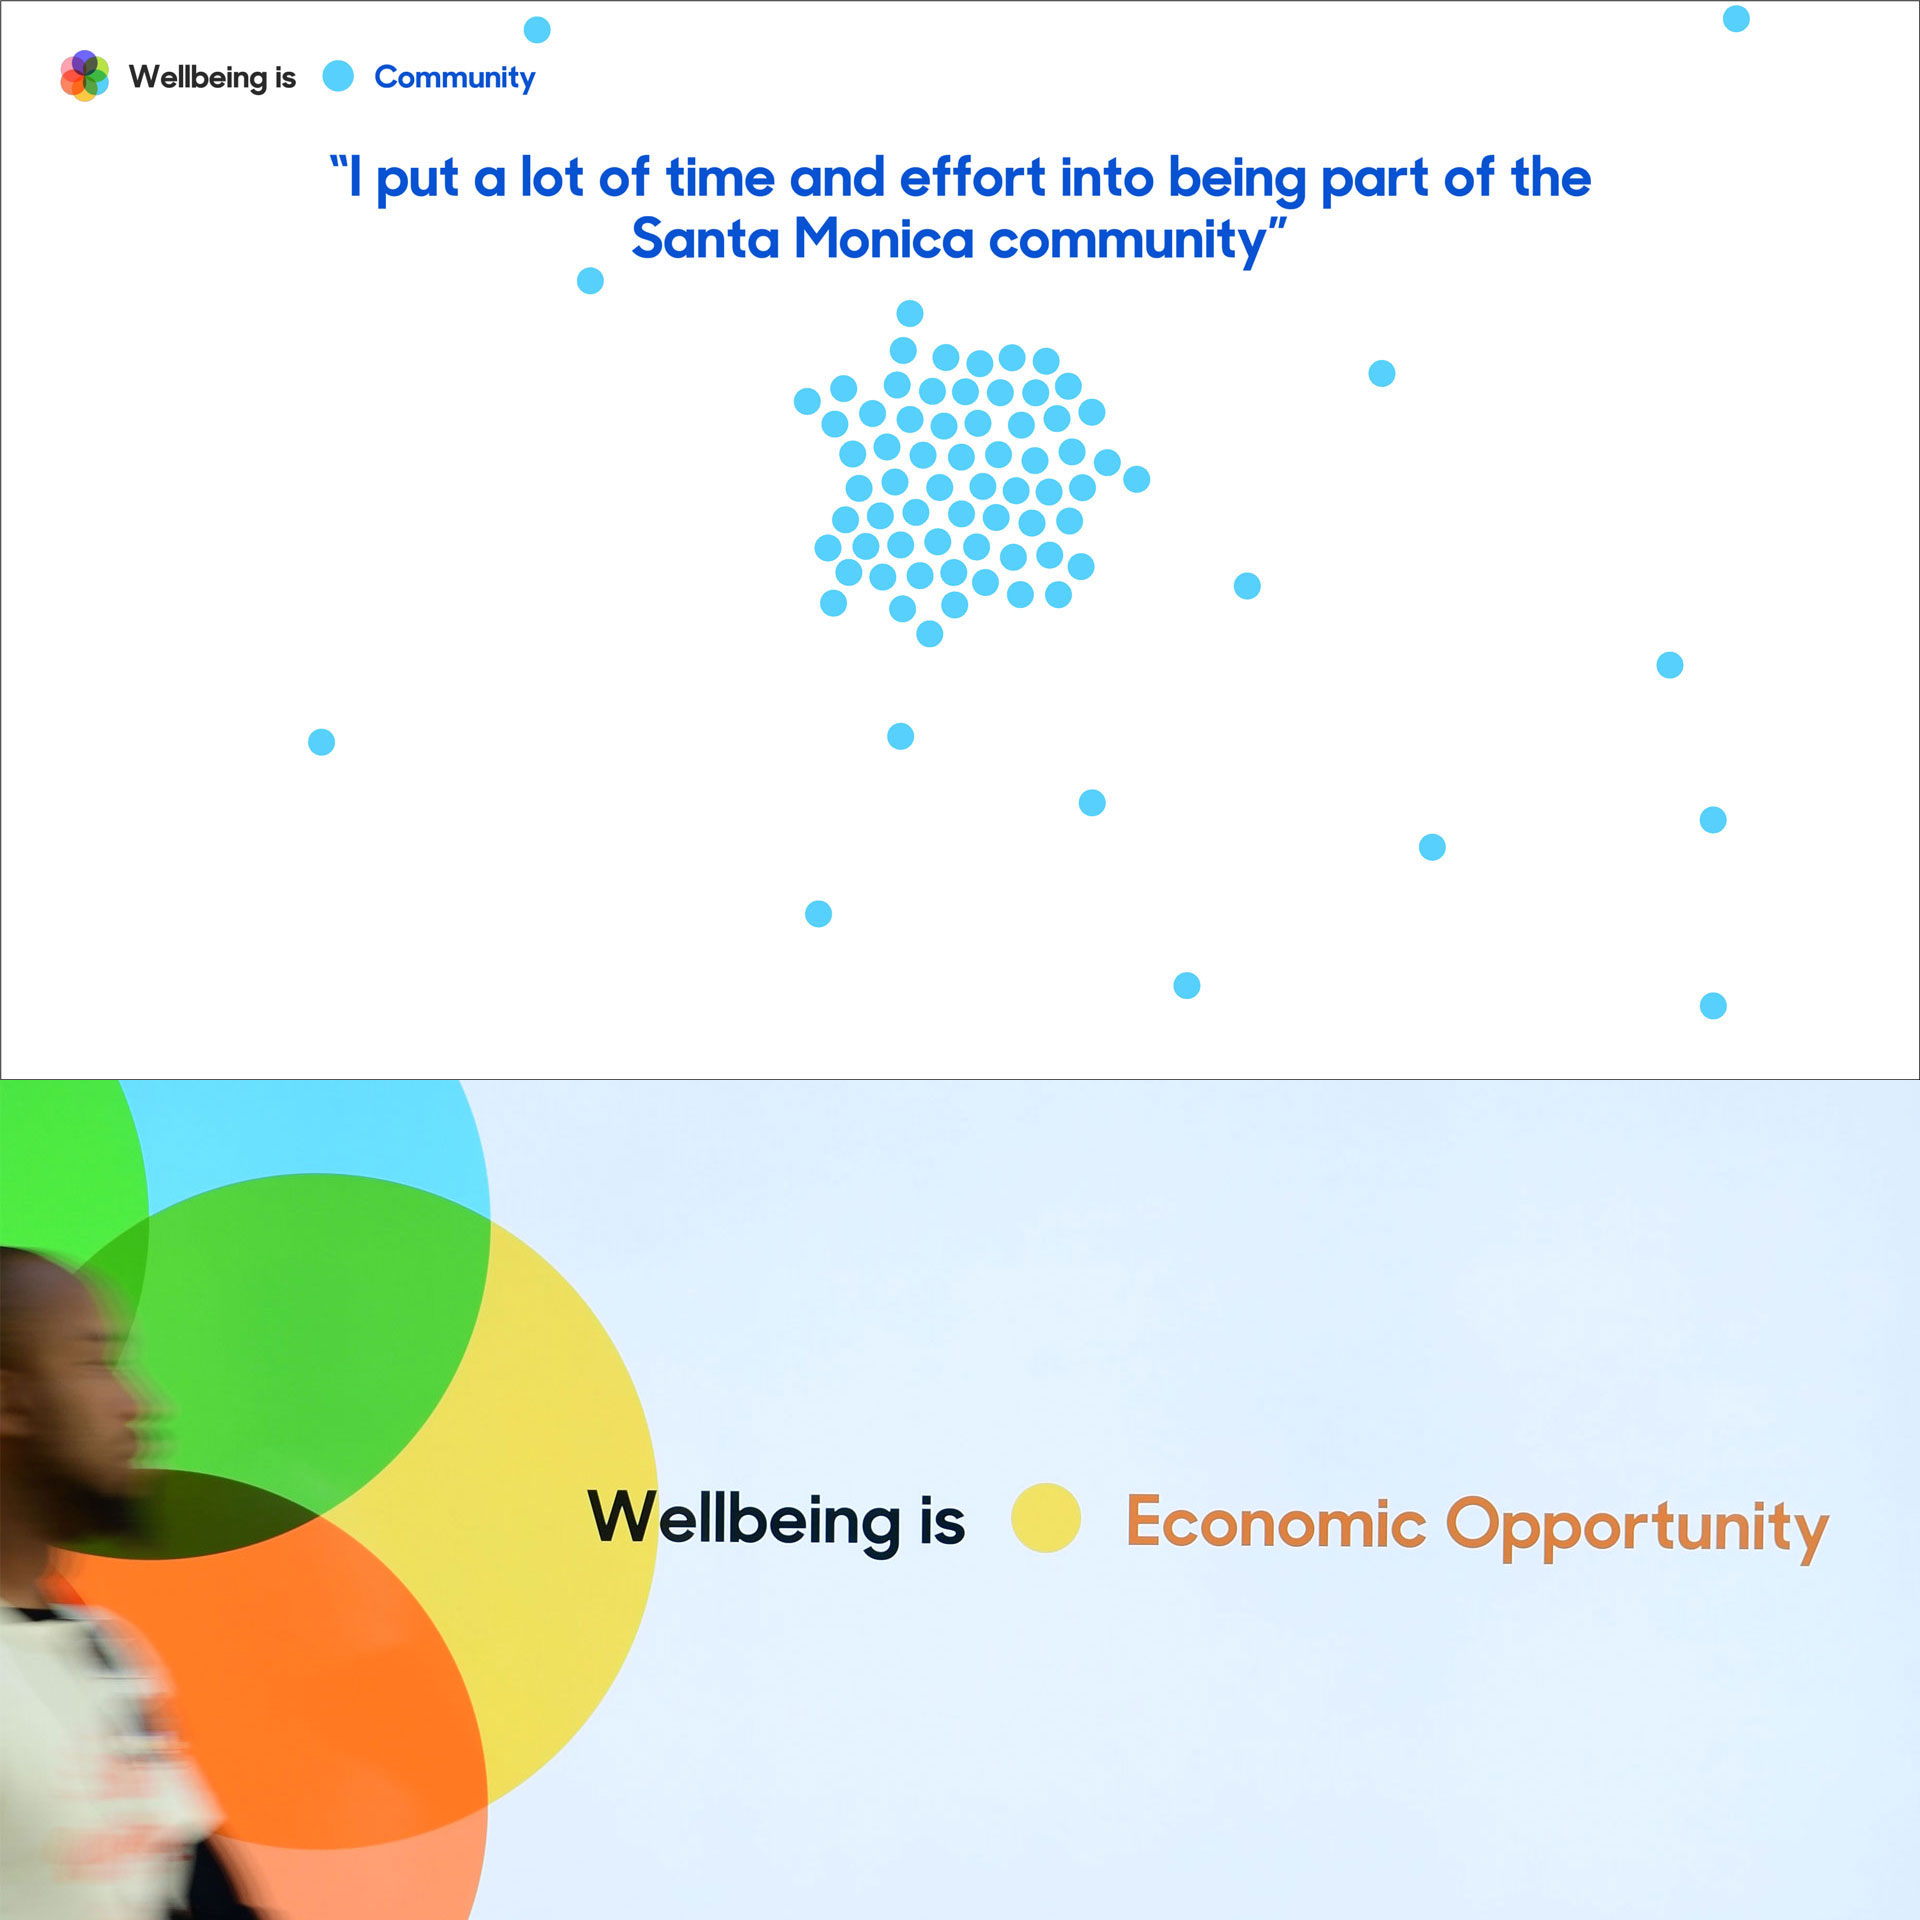
Schema Design Collaboration
City of Santa Monica Wellbeing
“To serve as a key visual display for the day, Schema created a bright, approachable, and informative media installation highlighting 100 curated data findings on Santa Monica’s wellbeing and the City’s associated programming.” I worked on the concept design and data analysis with Schema’s team in Seattle.
‘...& the West,’ Stanford University
For going on eight years, I’ve been working for with my former New York Times colleague, Felicity Barringer, on the Bill Lane Center’s “...& the West”, which examines western environmental and public health issues, and makes extensive use of infographics and maps.
...& the West
Where California Grows Its Food
A look at the most detailed survey ever done of crops and land use in California. It covers nine million acres of land devoted to grapes, alfalfa, cotton, plums, you name it – food for people and animals all over the world.
...& the West
Master Leasing Plans: A Mosaic of Competing Uses
Master Leasing Plans were intended to identify and resolve conflicts among competing resource needs on public lands run by the Bureau of Land Management. In areas where mineral and energy extraction interests might impinge on recreational, archeological, or conservation uses, Master Leasing Plans sought to balance those interests – with “no presumed preference for oil and gas development over other uses.”
...& the West
California’s Changing Energy Mix
A look at the energy sources California utilities have used gives us insights into the state’s progress in decarbonizing its electricity supply.
...& the West
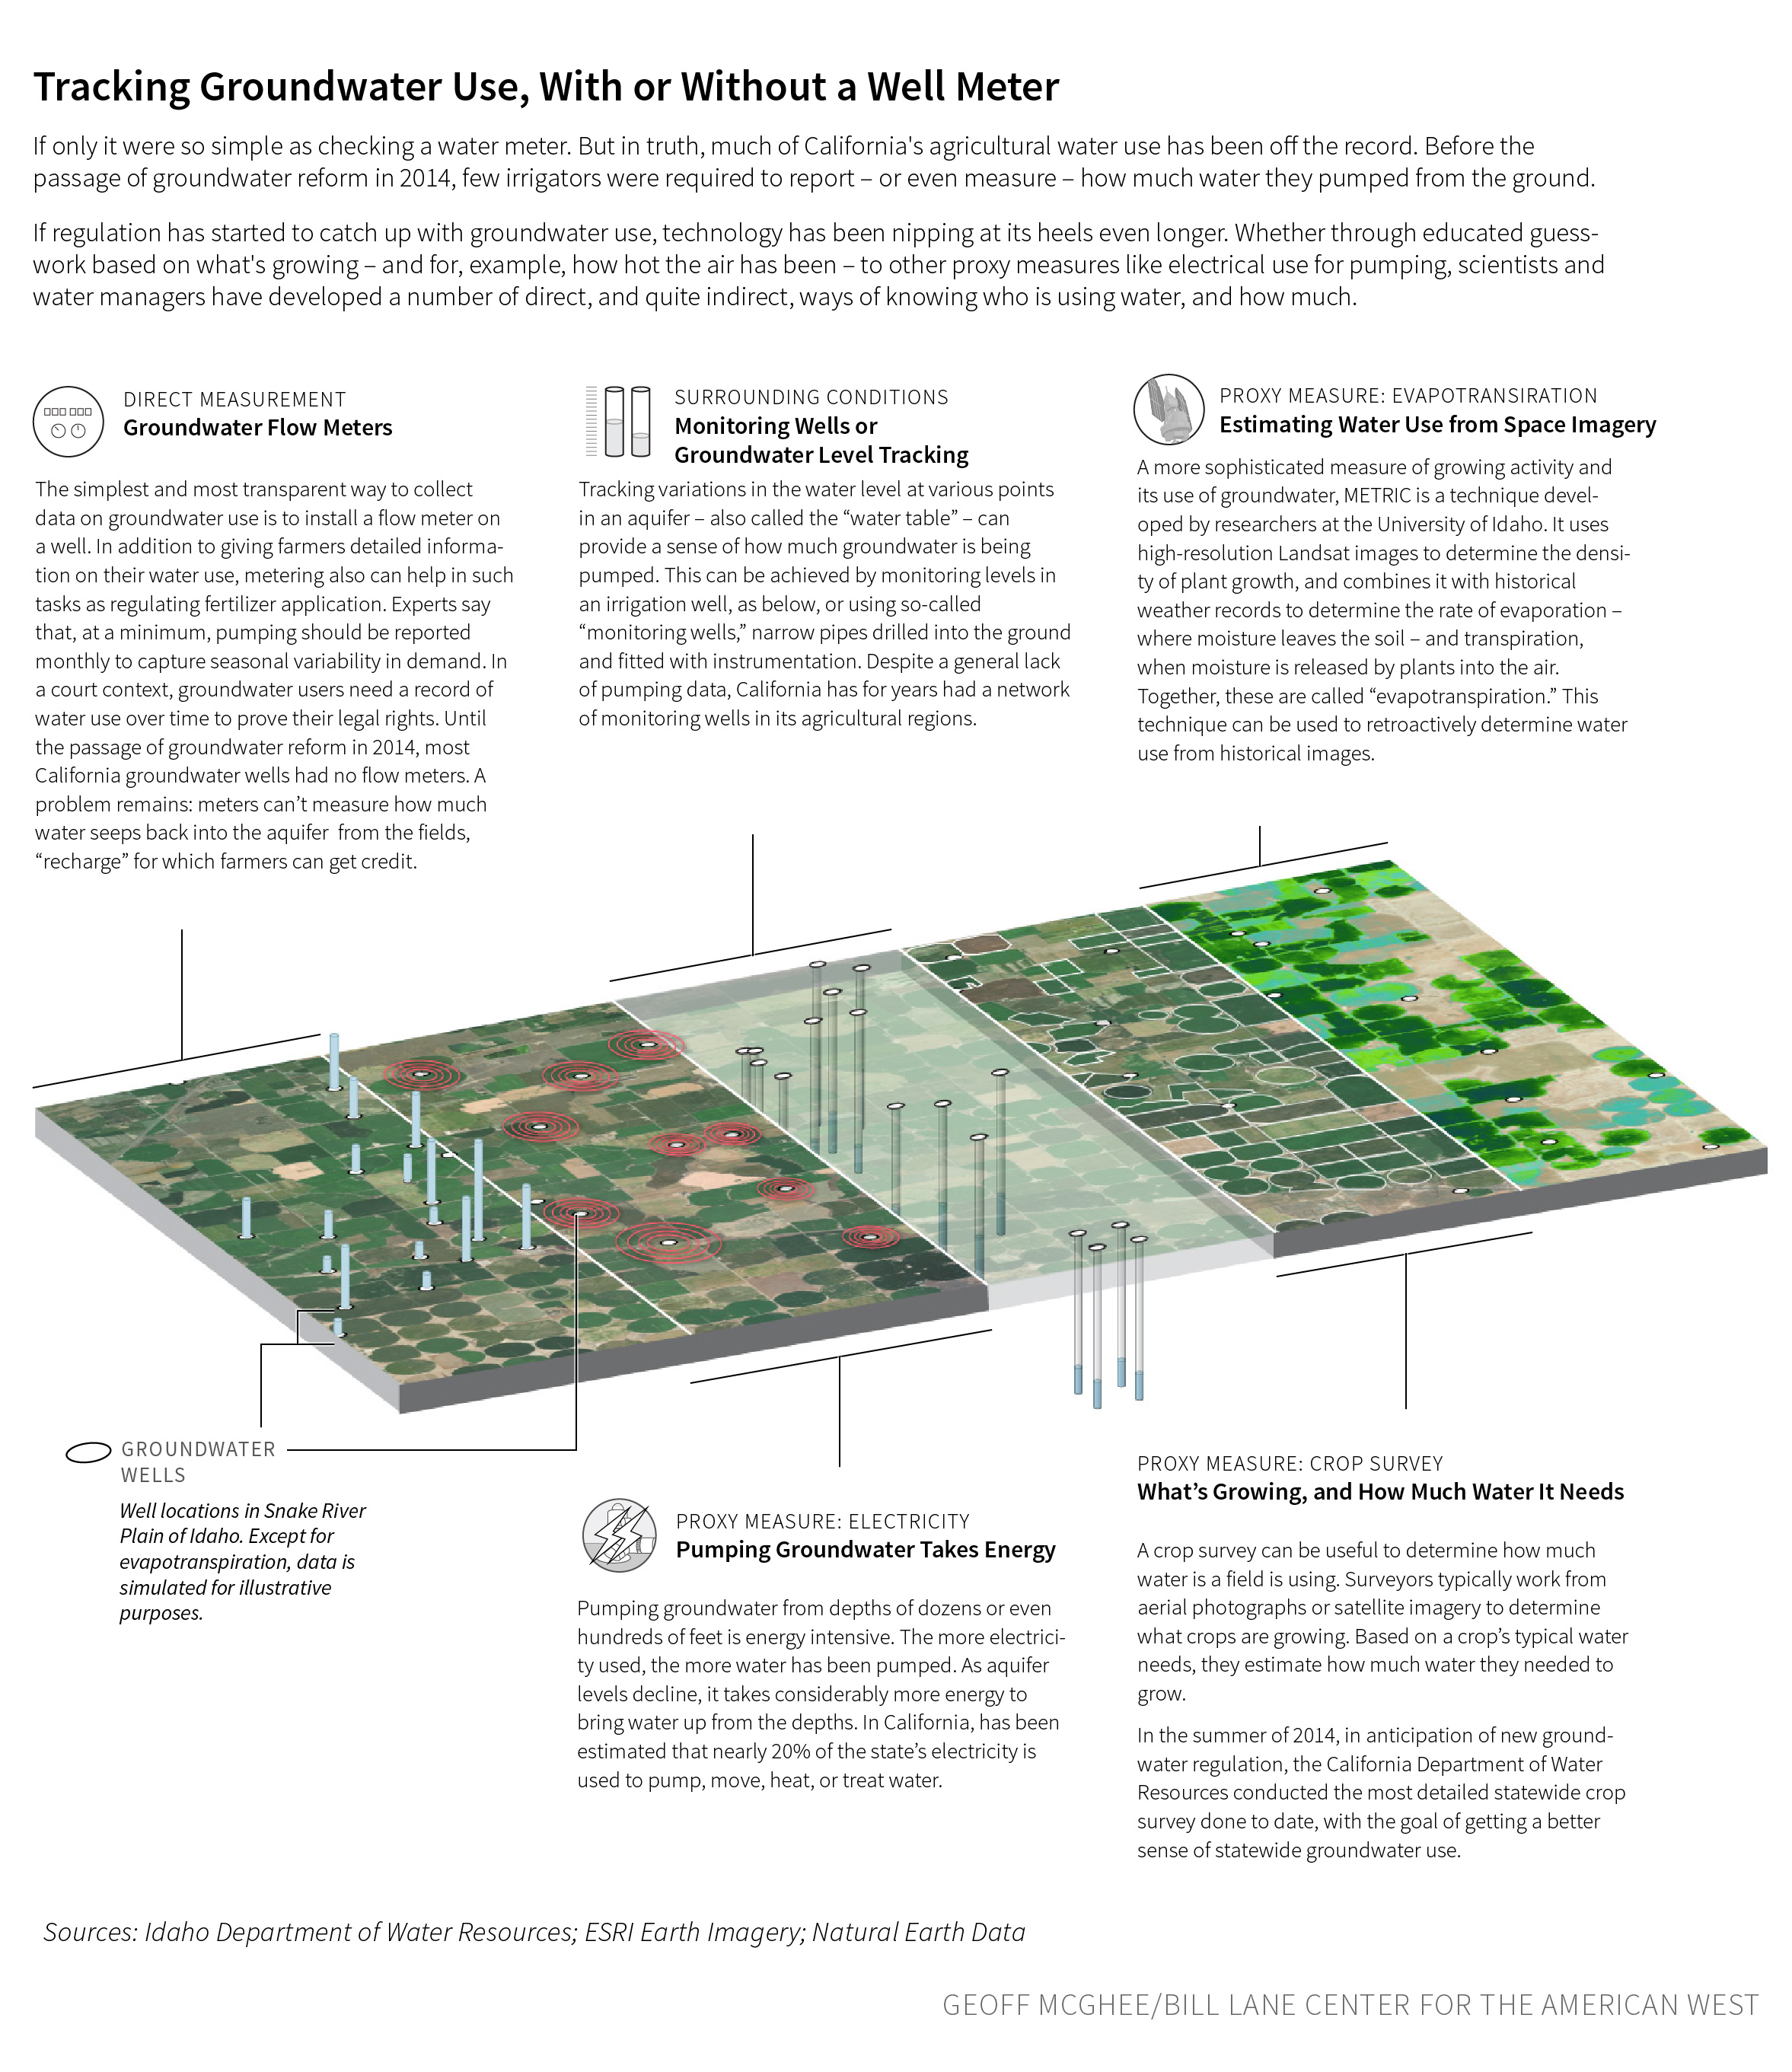
Tracking Groundwater Use, With or Without a Well Meter
If regulation has started to catch up with groundwater use, technology has been nipping at its heels even longer. Whether through educated guesswork based on what's growing – and for, example, how hot the air has been – to other proxy measures like electrical use for pumping, scientists and water managers have developed a number of direct, and quite indirect, ways of knowing who is using water, and how much.
...& the West
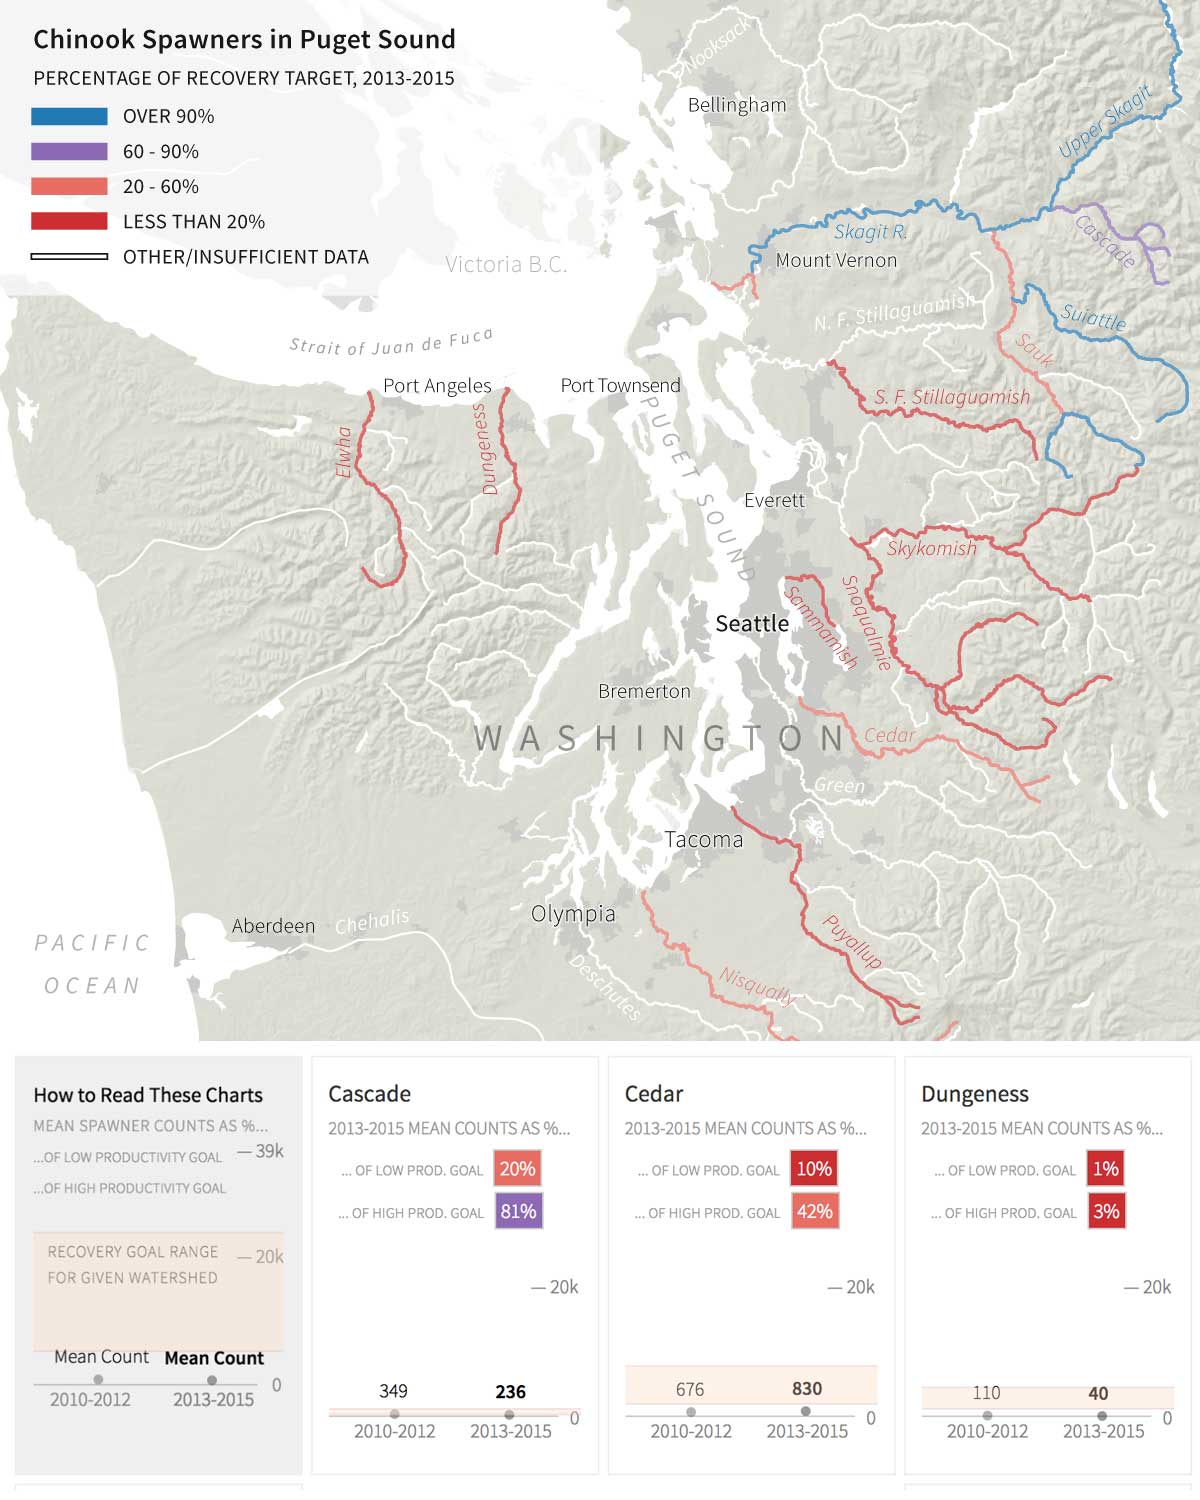
A Troubling Picture for Puget Sound Salmonids
As Puget Sound salmon populations dwindled throughout the 20th century, Washington state fish experts began keeping track of how many fish were returning to the rivers where they were spawned. During the first decade of the 21st century, across the rivers that drain into Puget Sound there was little measurable change in abundance for the 22 different populations of Puget Sound Chinook salmon.
Other Recent Projects
I’ve been working at the nexus of academic research and original journalism; I’ve had the chance to produce interactive documentary features like An Unquiet Landscape: the New American Energy Frontier with the late John McChesney, the veteran NPR journalist; explorations of western history with Harper’s Magazine; and environmental stories like “Envisioning California’s Delta as it Was” with KQED Public Media, and “Understanding California’s Groundwater” with our partners at the Stanford Woods Institute for the Environment.
Water in The West Project, Stanford University
Understanding California’s Groundwater
Groundwater is a crucial resource for Californians in both good times and bad, but it has been chronically depleted in many areas. This overview explores problems surrounding groundwater use and potential ways to address them.
Water in The West Project, Stanford University
Groundwater Permitting Dashboard
Here, we provide a state-of-the-art toolbox for understanding groundwater permitting approaches across the Southwest.
Oxford University Press
Information Graphics for “The Republic for Which It Stands”
Graphics and maps for Richard White’s book, The Republic for Which It Stands: The United States During Reconstruction and the Gilded Age, 1865-1896. “The newest volume in the acclaimed Oxford History of the United States series, The Republic for Which It Stands offers a magisterial account of the Gilded Age's real legacy that lies buried beneath its capitalists of legend and its corrupt politicians.”
Summer 2017
EcoWest Visualizations
Wildfire, Drought, Snow, and Precipitation Trackers
EcoWest analyzes, visualizes, and shares data on environmental trends in the North American West. All of our downloads and resources are free. EcoWest's interactive data visualizations are a collaborative project of Sea to Snow and the Bill Lane Center for the American West at Stanford University.
EcoWest Visualizations
Wildfire Animations
EcoWest analyzes, visualizes, and shares data on environmental trends in the North American West. All of our downloads and resources are free. EcoWest's interactive data visualizations are a collaborative project of Sea to Snow and the Bill Lane Center for the American West at Stanford University.
Rural West Initiative, Stanford University / Prairie Public TV
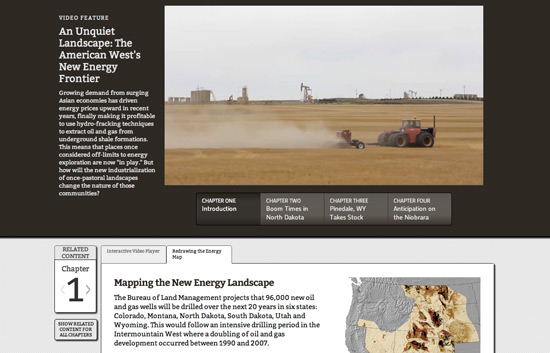
An Unquiet Landscape: America’s New Energy Frontier
High energy prices have made advanced drilling technologies profitable, pushing drill bits into parts of the West once believed tapped out, and into new places once thought inaccessible. A look at three communities in North Dakota and Wyoming who find themselves at different stages of an energy boom.
KQED Science
A History of Bay Area Open Space Conservation
The Bay Area has a long history of preserving its open lands. Today, about one-third of the region is designated as open space, from small city parks to lands stretching thousands of acres.
Texas Tribune
Comparing the Cost of Water
In the wake of a historic drought, and with the state's population poised to nearly double in the next half-century, a look at how Texas stacks up against other parts of the U.S. in water rates, single-family usage and weather.
Harper’s Magazine
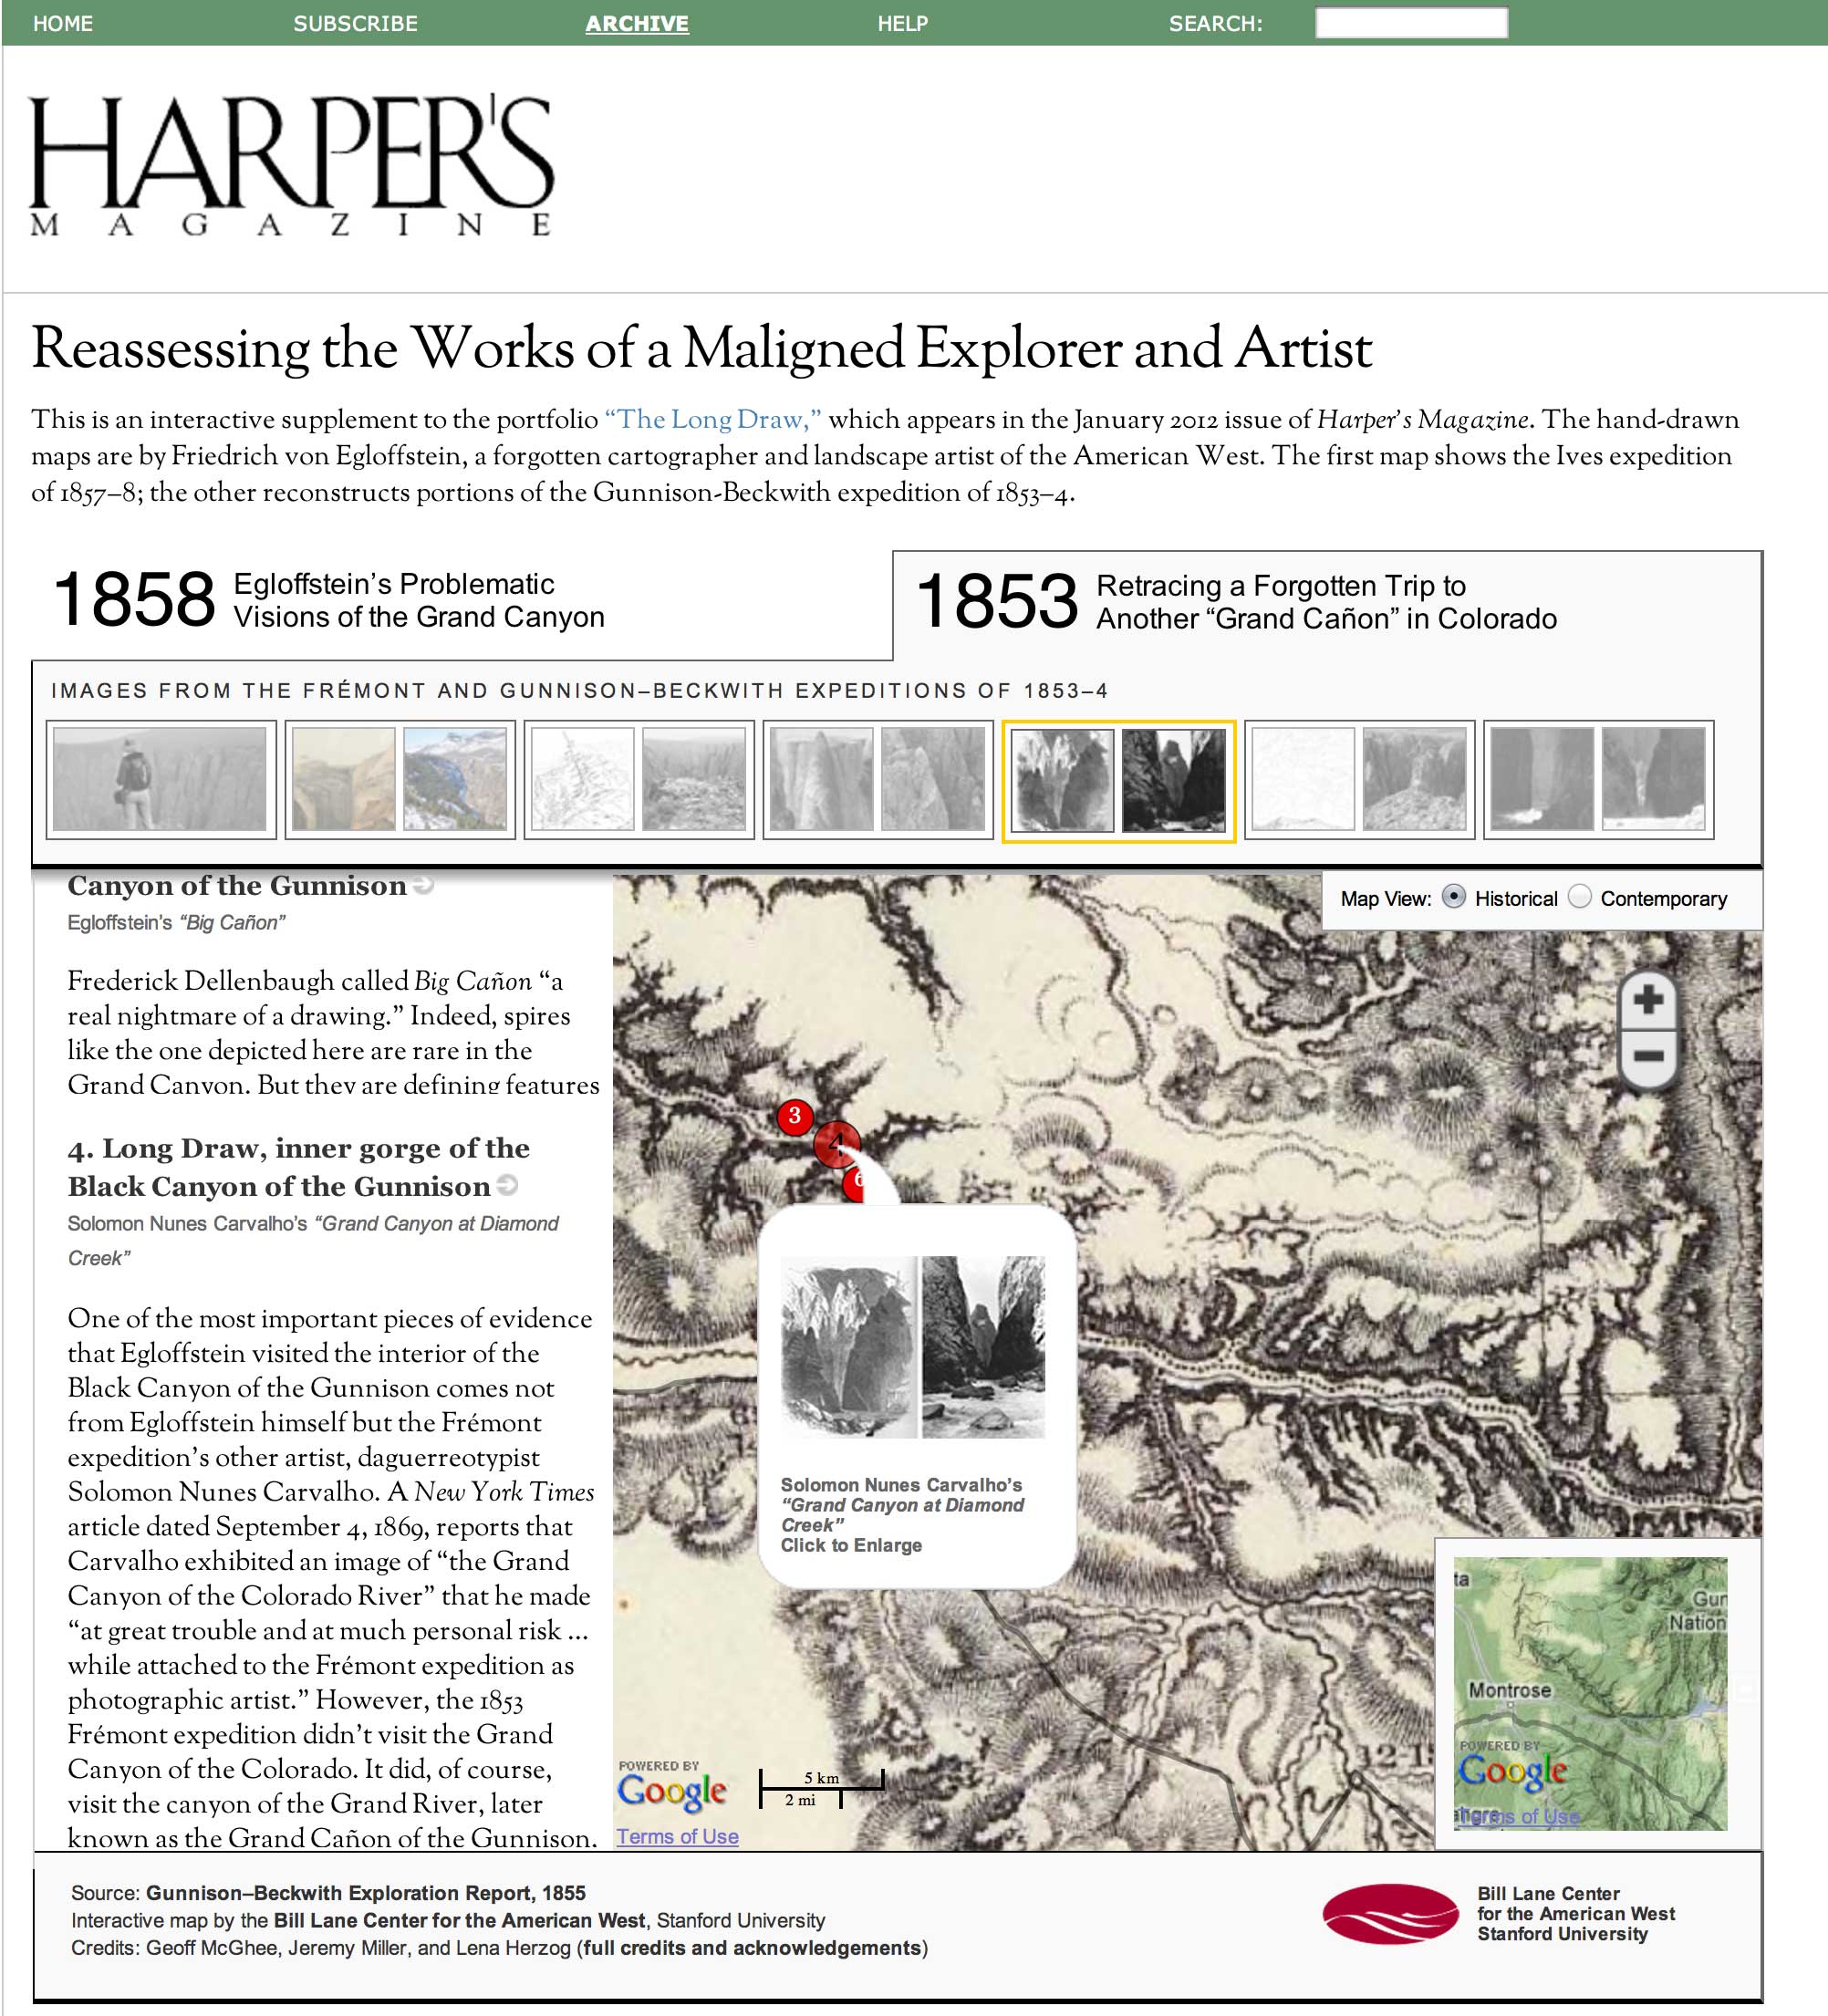
Reassessing the Works of A Maligned Explorer and Artist
An interactive supplement to the portfolio “The Long Draw,” which appeared in the January 2012 issue of Harper’s Magazine. The hand-drawn maps are by Friedrich von Egloffstein, a forgotten cartographer and landscape artist of the American West. The first map shows the Ives expedition of 1857–8; the other reconstructs portions of the Gunnison-Beckwith expedition of 1853–4.
KQED Quest
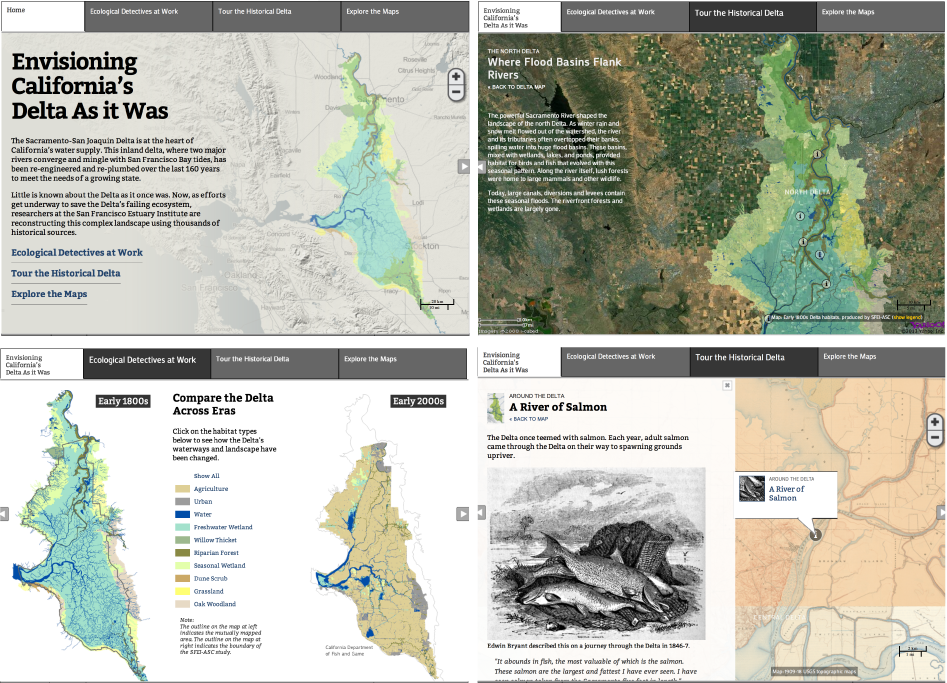
Envisioning California’s Delta As it Was
Little is known about the Sacramento-San Joaquin Delta as it once was. Now, as efforts get underway to save the Delta’s failing ecosystem, researchers at the San Francisco Estuary Institute are reconstructing this complex landscape using thousands of historical sources..
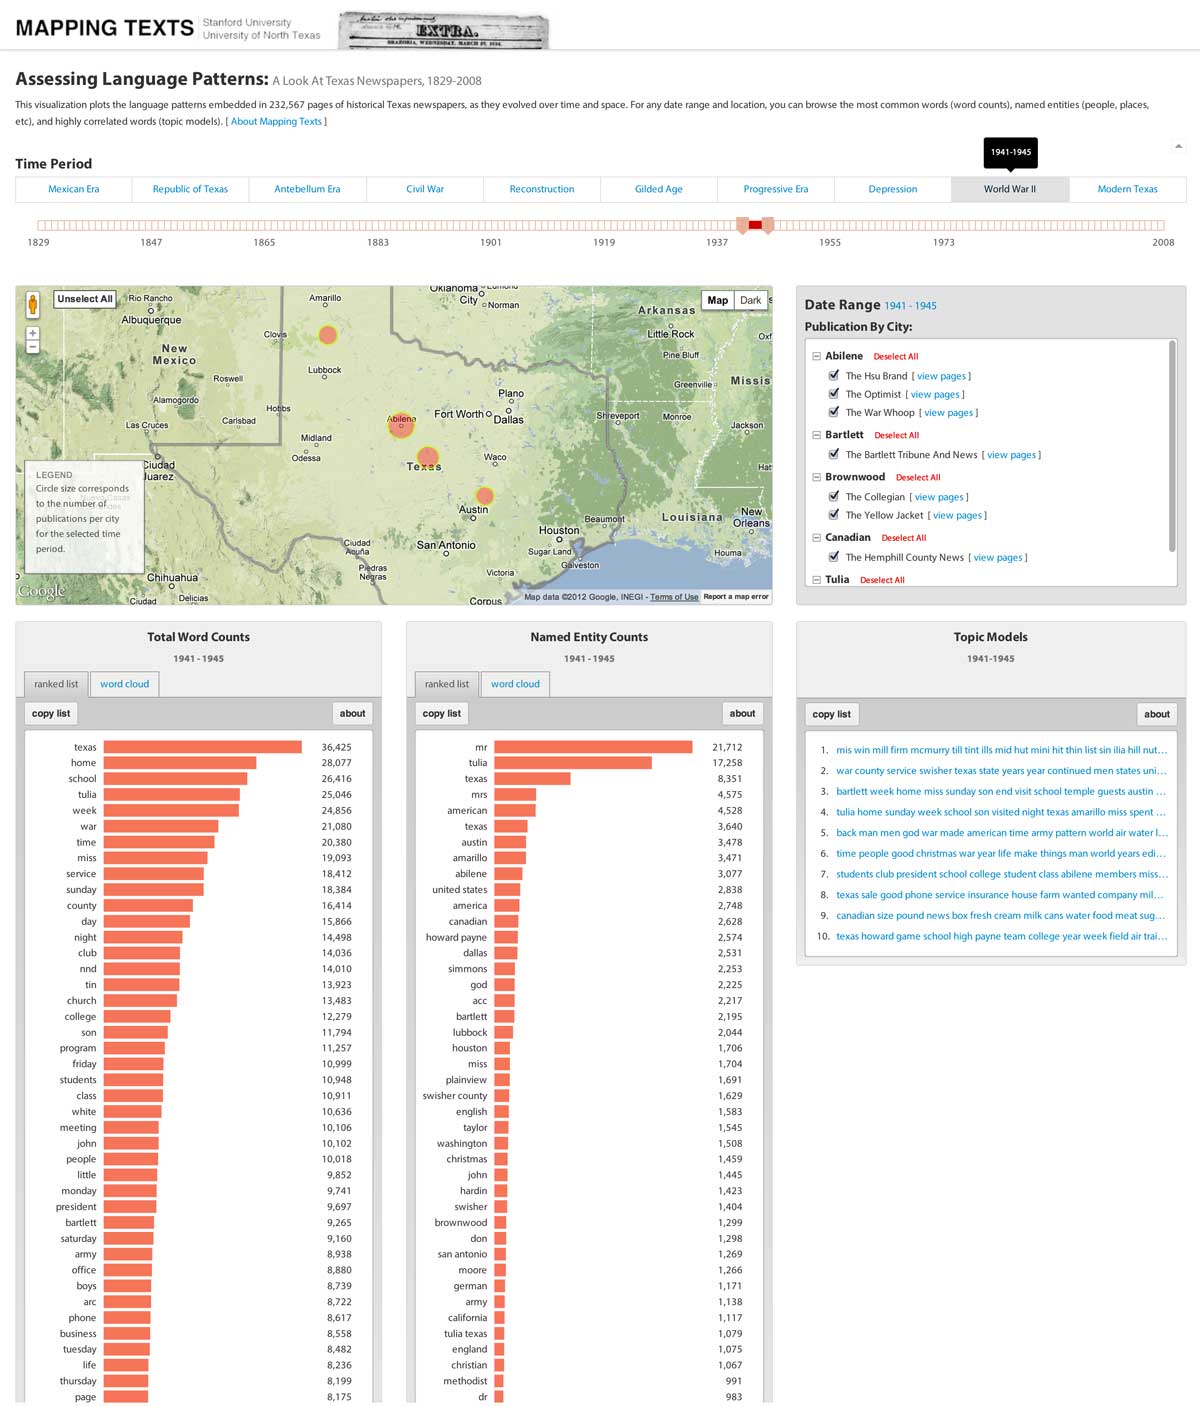
Mapping Texts – Stanford and University of North Texas
Assessing Language Patterns
An interactive supplement to the portfolio “The Long Draw,” which appeared in the January 2012 issue of Harper’s Magazine. The hand-drawn maps are by Friedrich von Egloffstein, a forgotten cartographer and landscape artist of the American West. The first map shows the Ives expedition of 1857–8; the other reconstructs portions of the Gunnison-Beckwith expedition of 1853–4.
Mapping Texts – Stanford and University of North Texas
Assessing Digitization Quality
Little is known about the Sacramento-San Joaquin Delta as it once was. Now, as efforts get underway to save the Delta’s failing ecosystem, researchers at the San Francisco Estuary Institute are reconstructing this complex landscape using thousands of historical sources..
Rural West Initiative/ High Country News
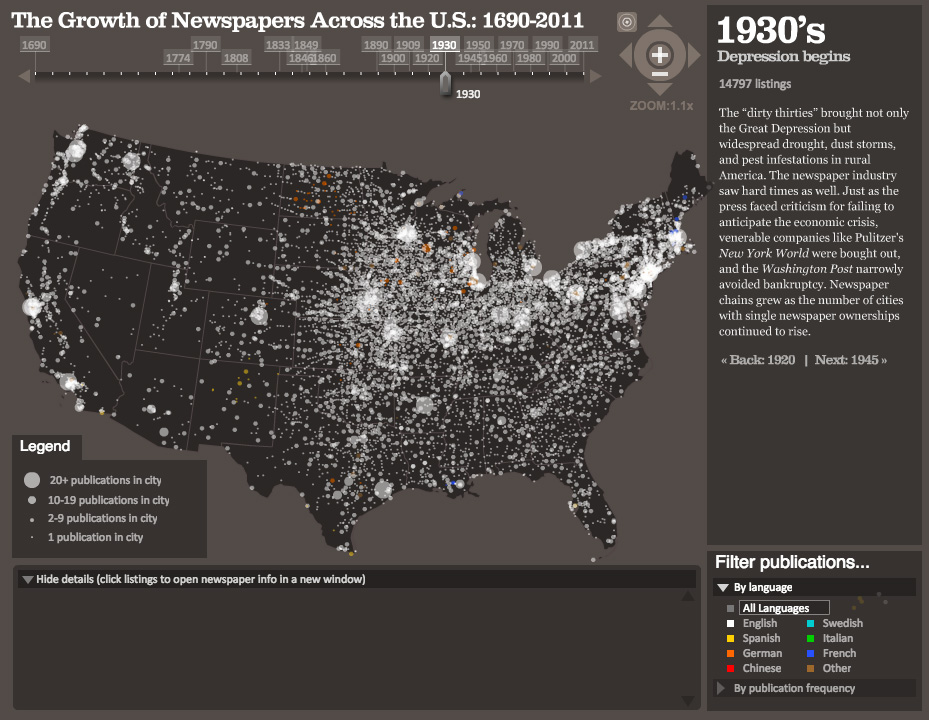
Journalism’s Voyage West
With American newspapers under stress from changing economics, technology and consumer behavior, it's easy to forget how ubiquitous and important they are in society. For this data visualization, we have taken the directory of US newspaper titles compiled by the Library of Congress' Chronicling America project – nearly 140,000 publications in all – and plotted them over time and space.
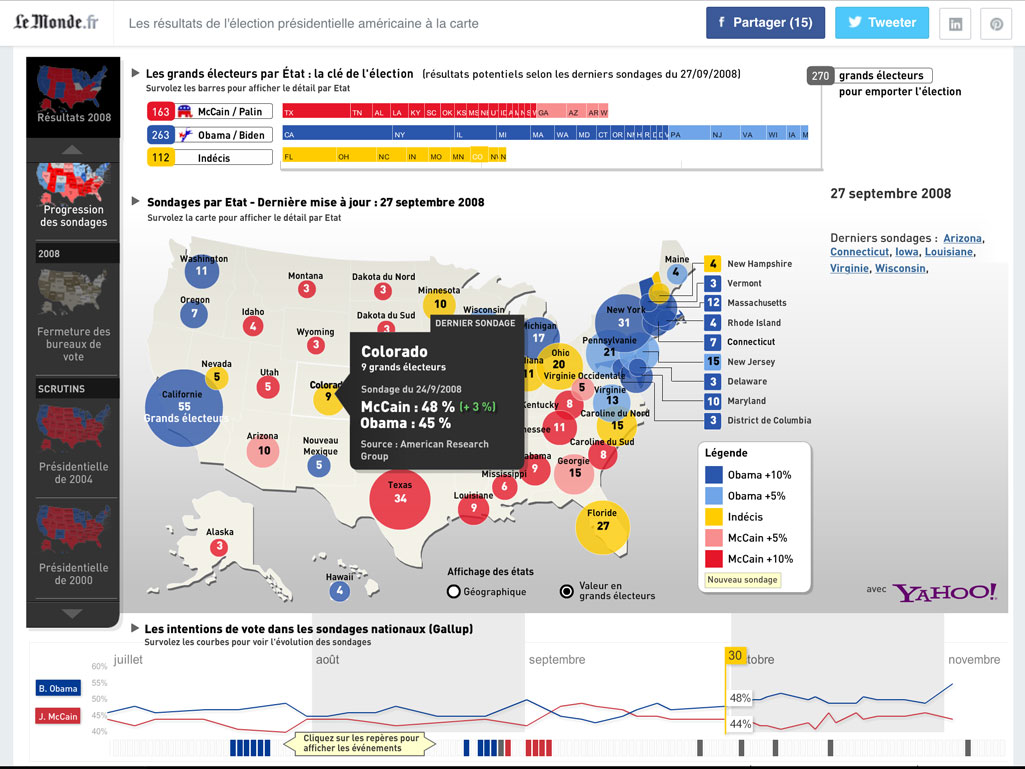
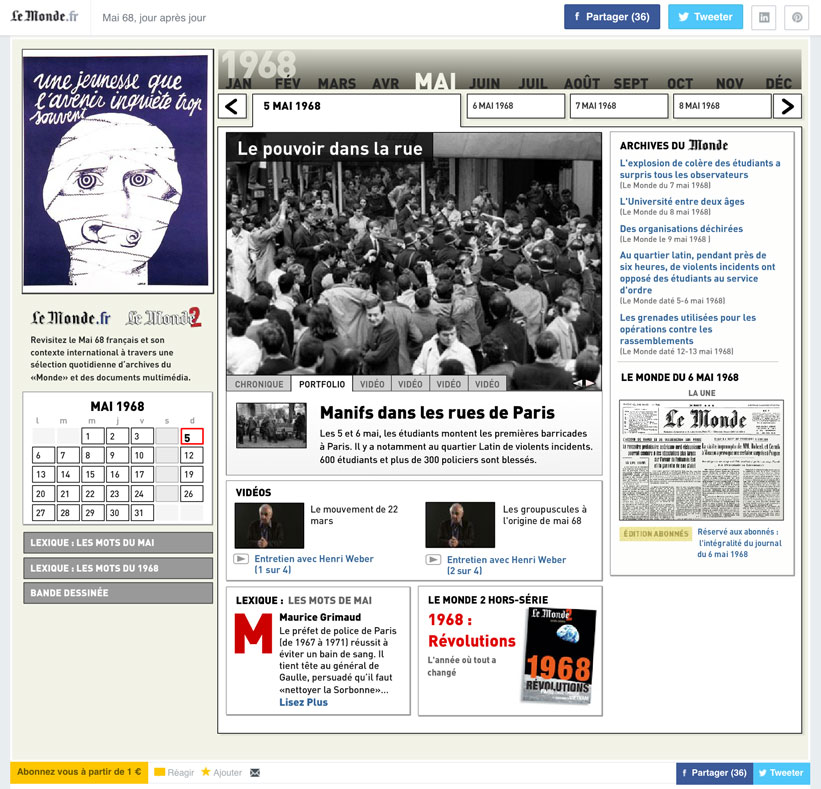
Le Monde
The U.S. Elections
Le Monde